[IMAGE: https://steemitimages.com/DQmbEdaUrbHvgK1ek5qovzS3kdKbF5FcmfTK3QSqrstSckZ/image.png]
So I have a simple as hell trading script. However I am no programmer so I'm sure this can be way better.
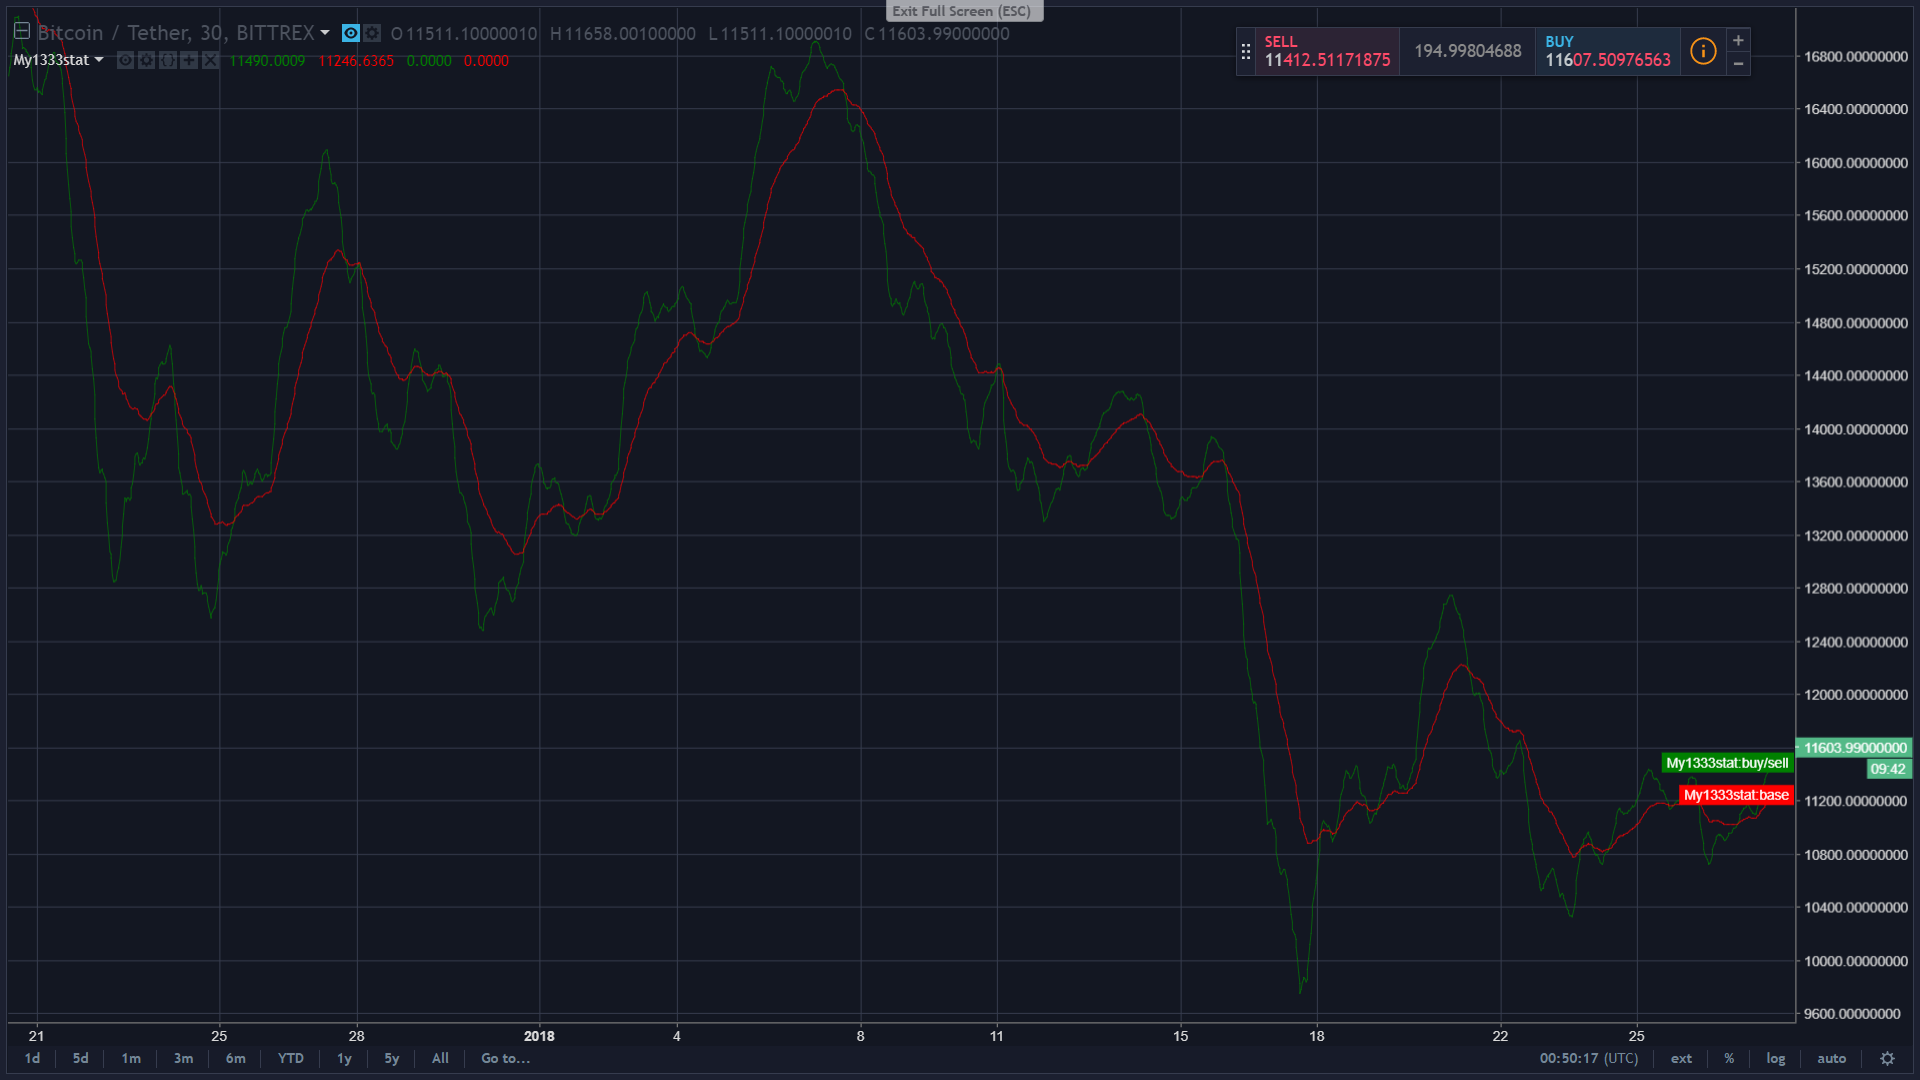
This is based on how I trade manually. I plot two EMA points. I set one at 13 and the other at 33. When the lines cross I either buy or sell. Dead simple right? This is for use with autoview.
Here's the code:
//@version=3
study("My1333stat", overlay=true)
fast = 17, slow = 80
fastMA = ema(close, fast)
slowMA = ema(close, slow)
plot(fastMA, color=green, title = "buy/sell")
plot(slowMA, color=red, title = "base")
buy_signal = crossover(fastMA,slowMA)
sell_signal = crossunder(fastMA,slowMA)
plotshape(buy_signal, style=shape.triangleup, color = green, text="buy")
plotshape(sell_signal, style=shape.triangledown, color = red, text="sell")
alertcondition(sell_signal, title = 'Sell', message = 'e=bittrex b=sell p=3% q=0.001 d=1')
alertcondition(buy_signal, title = 'buy', message = 'e=bittrex b=buy p=-3% q=0.001 d=1')