I don't usually bother to analyze web traffic on hive.blog, since I'm more focused on the technical development of Hive rather than Hive's success at marketing itself. Still, cloudflare send me a monthly email that shows the amount internet traffic on the site, including some geographical breakdown of that data. So I've long known that the US has consistently been the largest source of our web traffic, ever since the site first launched.
The inspiration of this post was a discussion I was having with @logic. He had found a post that was attempting to do an analysis of hive.blog's traffic based on organic search data (I think, I didn't read too closely) and it made a few incorrect conclusions about traffic on the site, so I decided to publish some of the data we have from cloudflare, after that discussion.
Hive.blog only has the data that cloudflare provides for free, so I can only access the last 30 days worth of traffic data, plus I have those monthly emails which allows me to get a little bit of historical data beyond the past 30 days. So I can only present a few graphs that may be of interest.
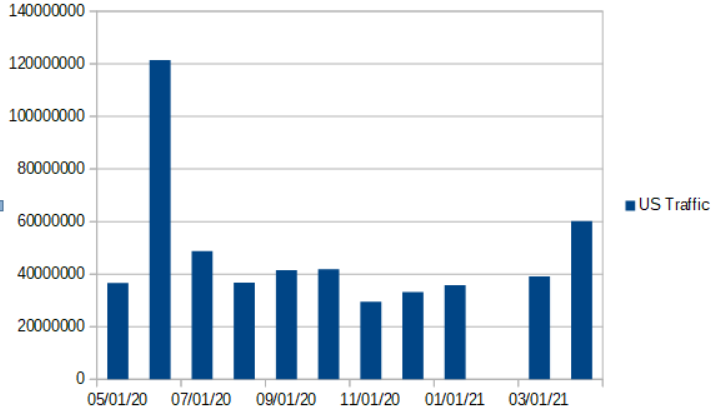
US web traffic for Hive.blog
This graph of US traffic was created by taking US traffic data from the emails (I deleted or moved the email from February apparently, so that's why there's a missing bar in the graph):
[IMAGE: https://images.hive.blog/DQmQtrVBAZmGZUGzBASQafVHsdXs6xh67ELsoWPqoCq2emC/image.png]
I'm not really sure why there was such a huge spike of traffic from the US during the month of May (120M), but there may not have been many other sites able to browse Hive posts during that month, so it may have born the brunt of Hive user traffic during that month. My best guess is that peakd, ecency, etc took away a lot of the traffic in the next month, once everyone could return to using their preferred post browser.
The graph shows there's been a steady growth of traffic from October of last year until now (2x growth of US traffic over that period), which is nice, especially since we know a lot of other web sites are getting more traction nowadays as post browsers and therefore competing for total Hive traffic. So overall, this looks pretty promising for overall growth of viewership for Hive social media posts.
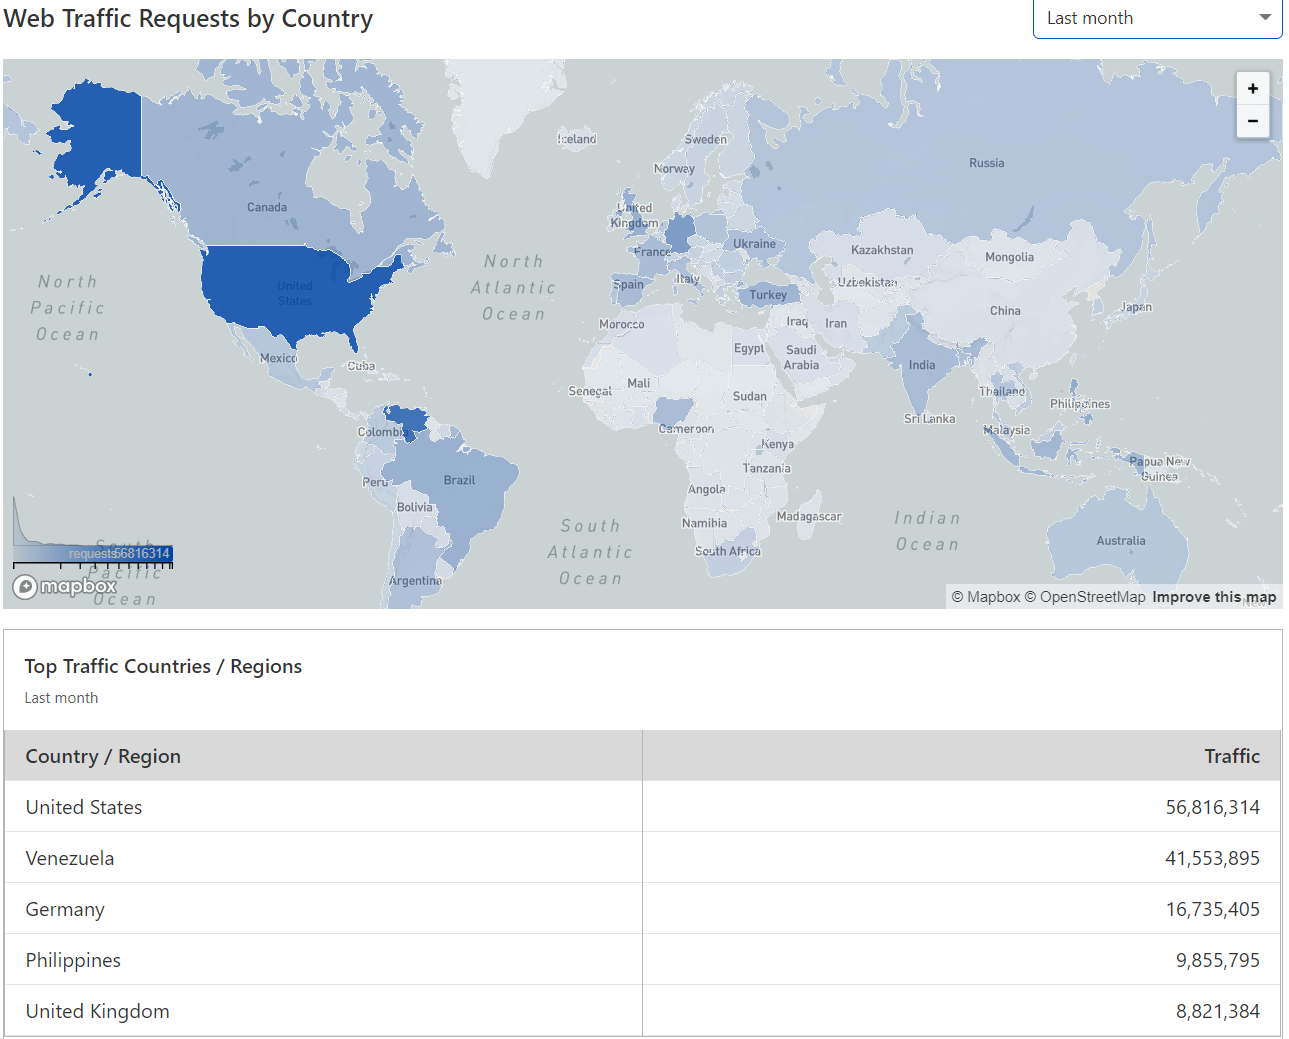
Heatmap for hive.blog's worldwide traffic
Here's a heatmap of global traffic to hive.blog, and a numeric breakdown of traffic from the top 5 countries in the last 30 days by country:
[IMAGE: https://images.hive.blog/DQmb9vvoBzQrQJPutwb5hnquU7KJHdRNCidggBkAVKDapVp/image.png]
A few more from the heatmap
I also manually looked up a few other countries on the heatmap (by mousing over them) and roughly sorted the results. Now, this was a fairly tedious process and there's a lot of countries, so please don't be upset if I missed your country.
* Brazil 8.5M
* Canada 7.4M
* Turkey 7.4M
* Indonesia 6.8M
* Spain 5.8M
* India 5.5M
* France 5.2M
* Nigeria 5M
* Ukraine 4.9M
* Italy 4.6M
* Argentina 4.2M
* Bangladesh 4M
* Poland 3.8M
* Russia 3.4M
* Thailand 3.1M
* Australia 3M
* Portugal 2.9M
* Mexico 2.9M
* Netherlands 2.8M
* Pakistan 2.4M
* Columbia 2.2M
* Vietnam 2M
* S. Korea 1.8M
* Romania 1.7M
* Bulgaria 1.5M
* Serbia 1.5M
* Malaysia 1.4M
* South Africa 1.4M
* Greece 1.5M
* Japan 1.1M
* Austria 1.2M
* Switzerland 1.2M
* New Zealand 1.2M
* Belgium 1M
* Peru 1M
* Chile 1M
* Czech 0.9M
* Sweden 1M
* Norway 0.9M
* Finland 0.8M
* Ireland 0.8M
* Belarus 0.7M
* Croatia 0.7M
* Ecuador 0.7M
* Taiwan 0.5M
* Estonia 0.5M
* Macedonia 0.5M
* Slovenia 0.5M
* Denmark 0.4M
* Slovakia 0.4M
* Hungary 0.4M
* Suriname 0.4M
* Israel 0.3M
* Lithuania 0.3M
* Uruguay 0.3M
* Paraguay 0.3M
* Panama 0.3M
* Costa Rica 0.3M
* Saudi Arabia 0.2M
* Iran 0.2M
* Egypt 0.2M
* Morocco 0.2M
* Kazakhstan
* Algeria 0.2M
* Dominican Republic 0.2M
* Latvia 0.2M
* Sri Lanka 0.2M
* Guatemala 0.2M
* Bolivia 0.2M
* Nepal 0.2M
* Iceland 0.1M
* El Salvador 0.1M
* Kenya 0.1M
* Cuba 0.1M
* China 0.1M
* Bosnia/Herz: 0.1M
* Moldova 0.1M
* Azerbaijan 0.1M
* Oman 0.1M
>Do you foresee hive.blog in the future being handed off to another front end team in some way?
We're not the core dev for condenser now. Hive.blog is just one site that uses the condenser code base.
Several developers contribute to the condenser code base, but @quochuy is probably the most prolific contributor right now, and you can find his contributions in his blog feed.
On our of devs, jsalyers on gitlab , also makes contributions to condenser. Generally his changes are to support and test new core features of Hive, like the recently added decentralized lists. Further back in time, we also used condenser to test the changes to the core API libraries to allow for swapping between API nodes when an API node is experiencing problems.
Other devs make changes to support their own dapps (@jpphotography recently made a contribution to support truvvl posts).
I did ask our devs to look at vision (the open-source code base for ecency), and we do expect to contribute to that code base as well in the future, once some more of my frontend devs free up from their current projects. Vision has a better and more modern design framework than condenser.
At one point, I was considering dropping all work on condenser and porting hive.blog to use vision'scode base instead of condenser's code base, but I've come to believe that condenser has one feature that is both a blessing and a curse: it supports server side rendering, which makes maintaining the code a pain, but is apparently very beneficial for organic search ranking. Because of this, I don't see us replacing condenser on hive.blog until this is no longer such a big issue. I think it's important that Hive has at one site that does well in organic search ranking.
I was trying to get the traffic analyzer working at one point, but as far as I recall, you guys use a custom jussi structure. Which meant that my jussi wasn't really capable of working with the traffic analyzer. I'll maybe look into it later on.
I think what Rishi meant (as well as some other people I've heard from) is mainly revolving around the networking of hive.blog -- unfortunately, it seems like OVH's network has been relatively on fire (pun intended) for the last couple of months, causing dropouts from time to time or in the best-case scenario, sudden latency spikes. (usually lasting about 10-ish seconds, but it's enough for it to error out).
Unfortunately, it's really hard to get a "usage metric" per se with jussi. The best possible ways I found so far were -- link usage (per second), bandwidth use (per month) and active connections to the node.
I may write a post on it soon.
For benchmarking, I think @fullnodeupdate overall is doing a great job. While it is sometimes vague and counts things that may mess up the stats (block latency, for example, which isn't always accurate) it's a nice overlook to most nodes.
Check with @gtg, he can assist you in getting your logging correct. It's not really "custom jussi structure", just a configuration of the log settings. IMO, it shouldn't be difficult, with a little assistance, and I think it should work fine for a usage metric.
I don't think the issue is OVH (other than that one time, when there was an actual fire), but we have seen cases where cloudflare has blocked some locations (while most locations are simultaneously able to access it without a problem). I suspect it's related to their DDOS attack prevention system. There are occasional attacks launched against our jussi node.
I have my doubts about all the remote benchmarking tools I've seen. They mostly seem to report different results depending on where you run them from. That's why I think local data at the node is best, if you're trying to measure performance of the node itself, and not external network issues.
> I don't think the issue is OVH (other than that one time, when there was an actual fire), but we have seen cases where cloudflare has blocked some locations (while most locations are simultaneously able to access it without a problem). I suspect it's related to their DDOS attack prevention system. There are occasional attacks launched against our jussi node.
Hmm, might be. OVH's own DDOS protection might be dropping packets too.
> I have my doubts about all the remote benchmarking tools I've seen. They mostly seem to report different results depending on where you run them from. That's why I think local data at the node is best, if you're trying to measure performance of the node itself, and not external network issues.
I agree, That's why I think looking at active DL/UL rate and overall monthly bandwidth usage, as well as established netstat connections (for 443 should work, more or less) to be able to (at least partially) understand the average use on the node.
It seems like on average in April 2021 (so far) api.deathwing.me used more than 2.5 TB BW (uploaded) with an average of 10 Mbps. Overall established connections stay at about ~650. I've seen it get close to ~1k when api.hive.blog had an issue a couple of weeks ago. (though this just shows the active users at the time of checking it, so the majority are probably bots.)
Even without any statistics and just looking at overall use on logs, I can honestly say that I would not be surprised if api.deathwing.me is the second most used node on the chain.
I was wondering if it would be possible to somewhat implement/upgrade jussi with some new features such as monitoring active connections, calls, chart data etc. In other words, log everything in an organised manner and make it easy so we don't have to scour through tens of gigabytes of logs :P (I know @good-karma was building a project, an upgraded version of jussi, but I don't know it's latest status.)