Bitcoin Technical Analysis 2/13/18
By: BunLogic
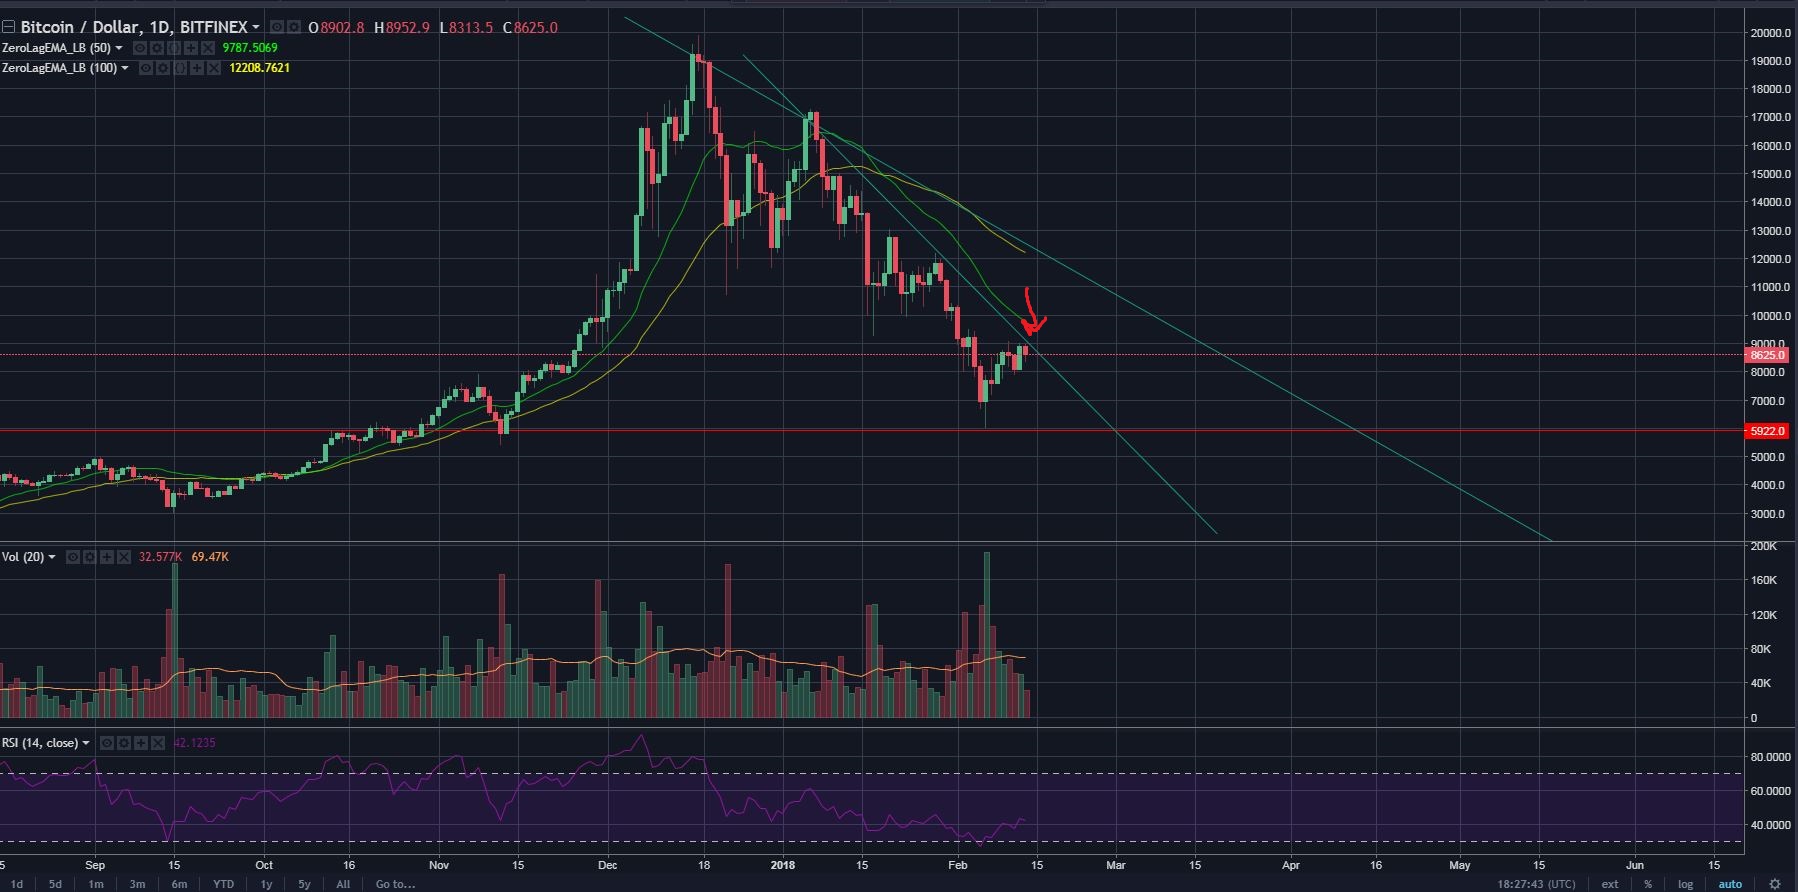
What a day! From the picture below we can see that the $9,000 resistance are putting the bulls to a completely stop. Not to say we can’t break this resistance, but this allows us to do some short term trades.[IMAGE: https://steemitimages.com/DQmXj33baTB4X8jZG5sFmrDwx1jK33hXdHwn13izR9Gv6Cx/btc1.JPG]
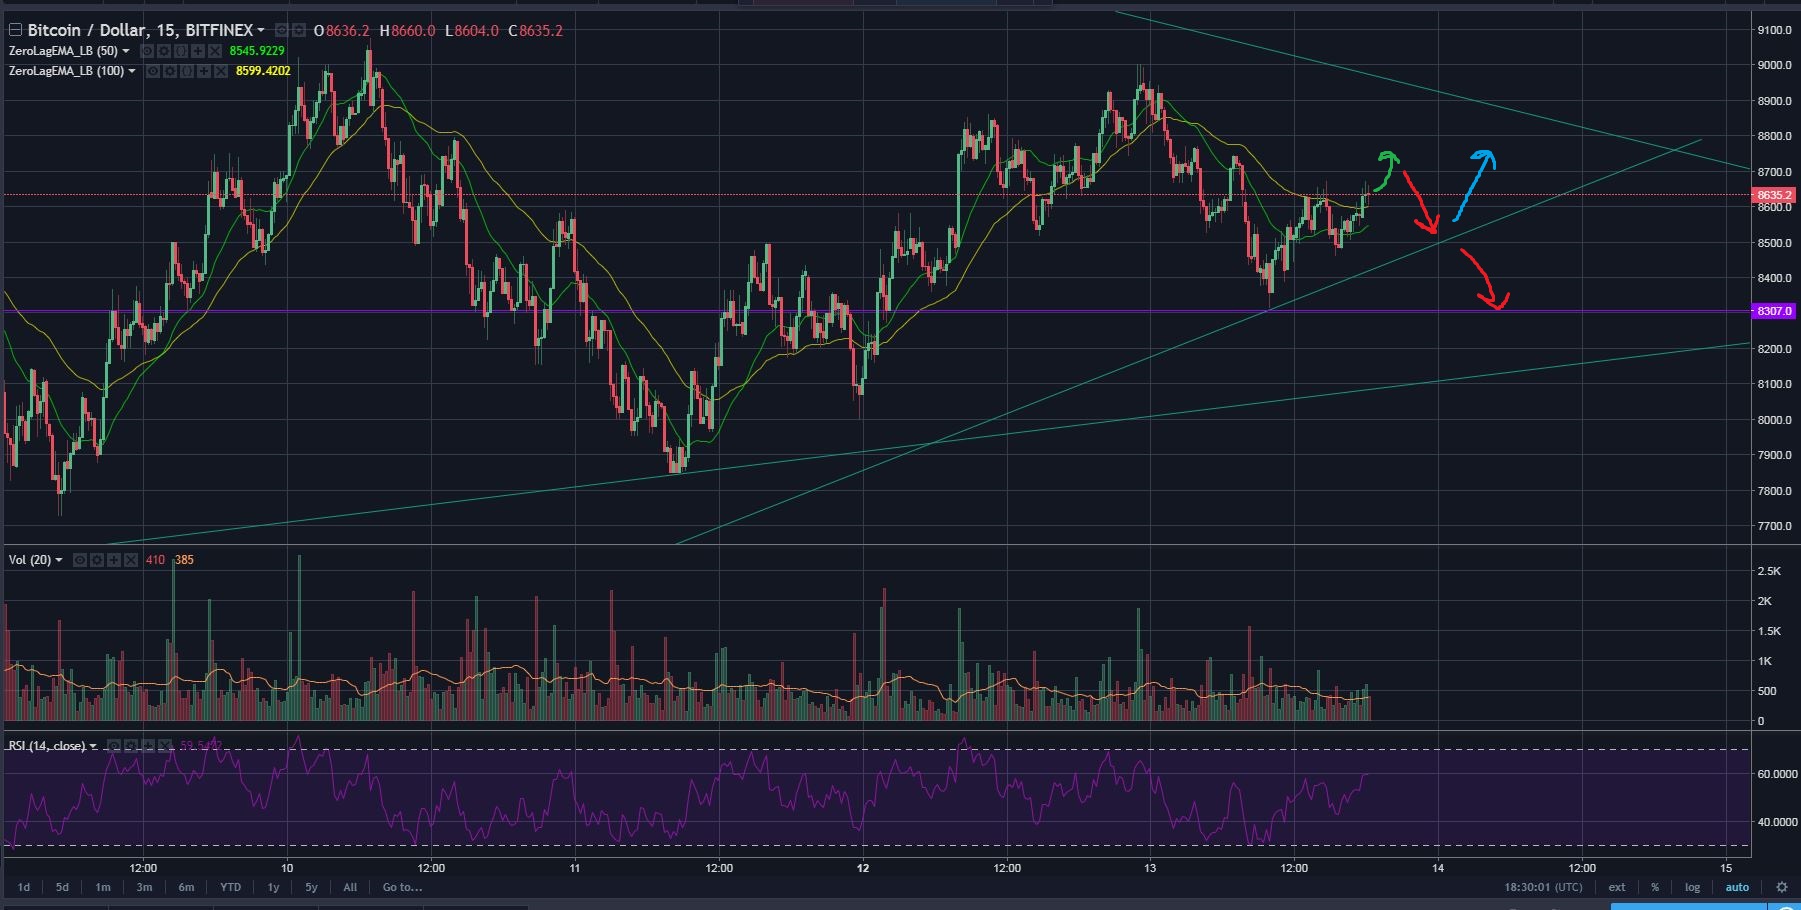
The $8,633 seems to be losing steem (teehee). We can see two scenarios here.
-Either a small up ward moment to test the ~8750 resistance
-or downward moment testing this upward trend line.
If BTC rallies around this trend line, we can see a quick up thrust surpassing the 8,700 zone. If volume doesn’t pick up We will end up testing this soft 8,307 resistance.
[IMAGE: https://steemitimages.com/DQmY1iUi4X7ExZKX4wc7i2Uu2vQpVCEECF5p5fbuVertuPY/btc2.JPG]
Thanks for reviewing my post, and please leave your feedback.