[IMAGE: https://cdn.steemitimages.com/DQmTHyV2BLFTfPEWXRxvmV3txoiUBYC8bjyVLUEbgGfCh2B/image.png]
(picture is made by @cryptostock)
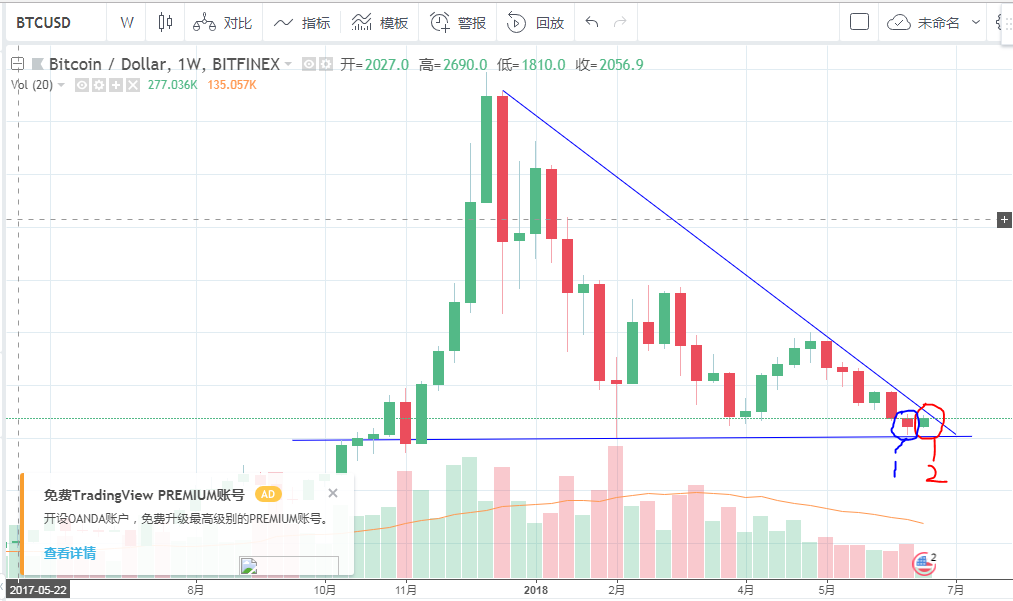
From this chart (compared with the last week :)https://steemit.com/bitcoin/@cryptostock/bitcoin-news-and-trending)
The blue circle stands for the last week candle. The red circle stands for this week candle. As you see , up to now the weekly candle chart is still under the downtrend line .
Sometimes the simple sign signs the root cause. Pls keep patient to attend this game.
>P.S. :Disclaimer: This is not a investment information or advice. "The information provided in this blog post and any other posts that I make and any accompanying material is for informational purposes only. It should not be considered financial or investment advice of any kind".