Summary:
Where do I see Litecoin headed?
Using a very simple trading strategy, that is highly accurate (Supply and Demand Trading) i did not find any demand zones or support on the monthly chart the only demand zone i see there is at 40 dollars. and i hope that is not where its headed, so instead lets take a look at the lower time frames as they seem interesting.
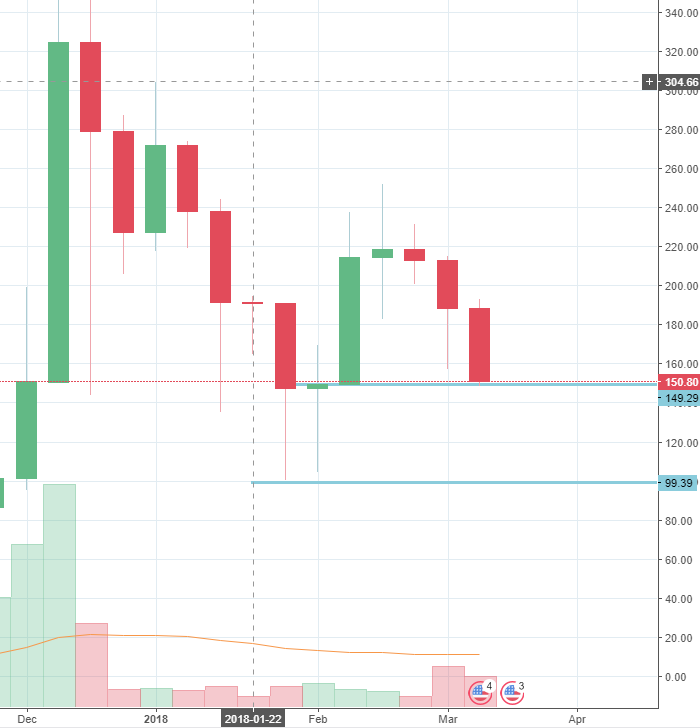
The weekly chart below show that LTC is entering a weekly demand right now, this is where it will start to see some buyers and support. See first chat below
[IMAGE: https://steemitimages.com/DQmWCBJWVRT3hp8U2jXiyhSZjEyTapXyMV8QHZ2pcCbXsLq/LitecoinWeekly.PNG]
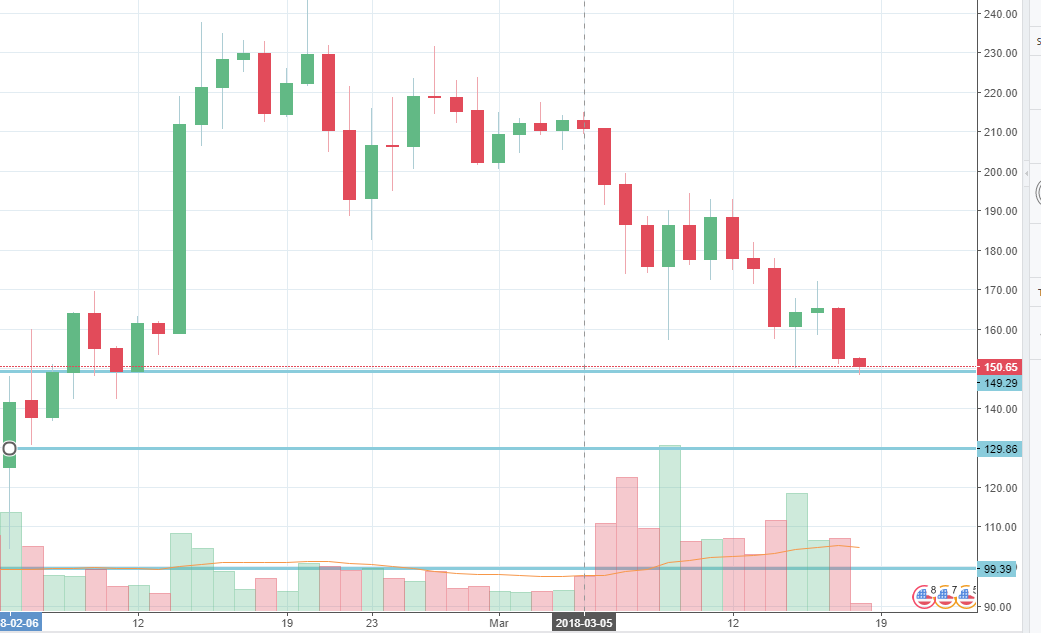
Now that we know where we standing on the weekly chart we must also look at the daily chart to fine tune our entry. we want to see a place where the weekly and daily will align.
Daily chart is showing there is a demand zone here as well, the range is from $150 to $129, i will wait a couple days to see if it shows rejection in this area, rejection will look like a hammer or some other similar candle stick pattern. any sign of reversal in this area will make this a great trade.
[IMAGE: https://steemitimages.com/DQmQ1SxCTkuGhJhuSG8spCbmV7xCAXD72qib5dVLTTZrNZ2/LitecoinDaily.PNG]
What is a demand zone? ?, Its an area of the chart where a lot of people agree its a good price to buy. many people buying in the same area makes the coin rise. The strategy works on every trading vehicle. Seems to work very well on Crypto.
Conclusion : Some coins seem to be showing a bottom here, some will bounce before others but i see a good low price to buy soon across all coins.
Thanks for watching