In this post I will share some of my TA so you can see what targets we will get in future.
They are all in fibonacci sequence and connected from past.
In this post I will NOT say where do we go and what targets will be hitted. I will share how it is in couple of BitCoin charts.
Before you look at them know:
- If the price is below the line or ring it will be resistance
- If the price is above the line or ring it weill be support
- When we cross the ring we are preapared for the move. We can see how had played out in past and predict the higher possibility for move.
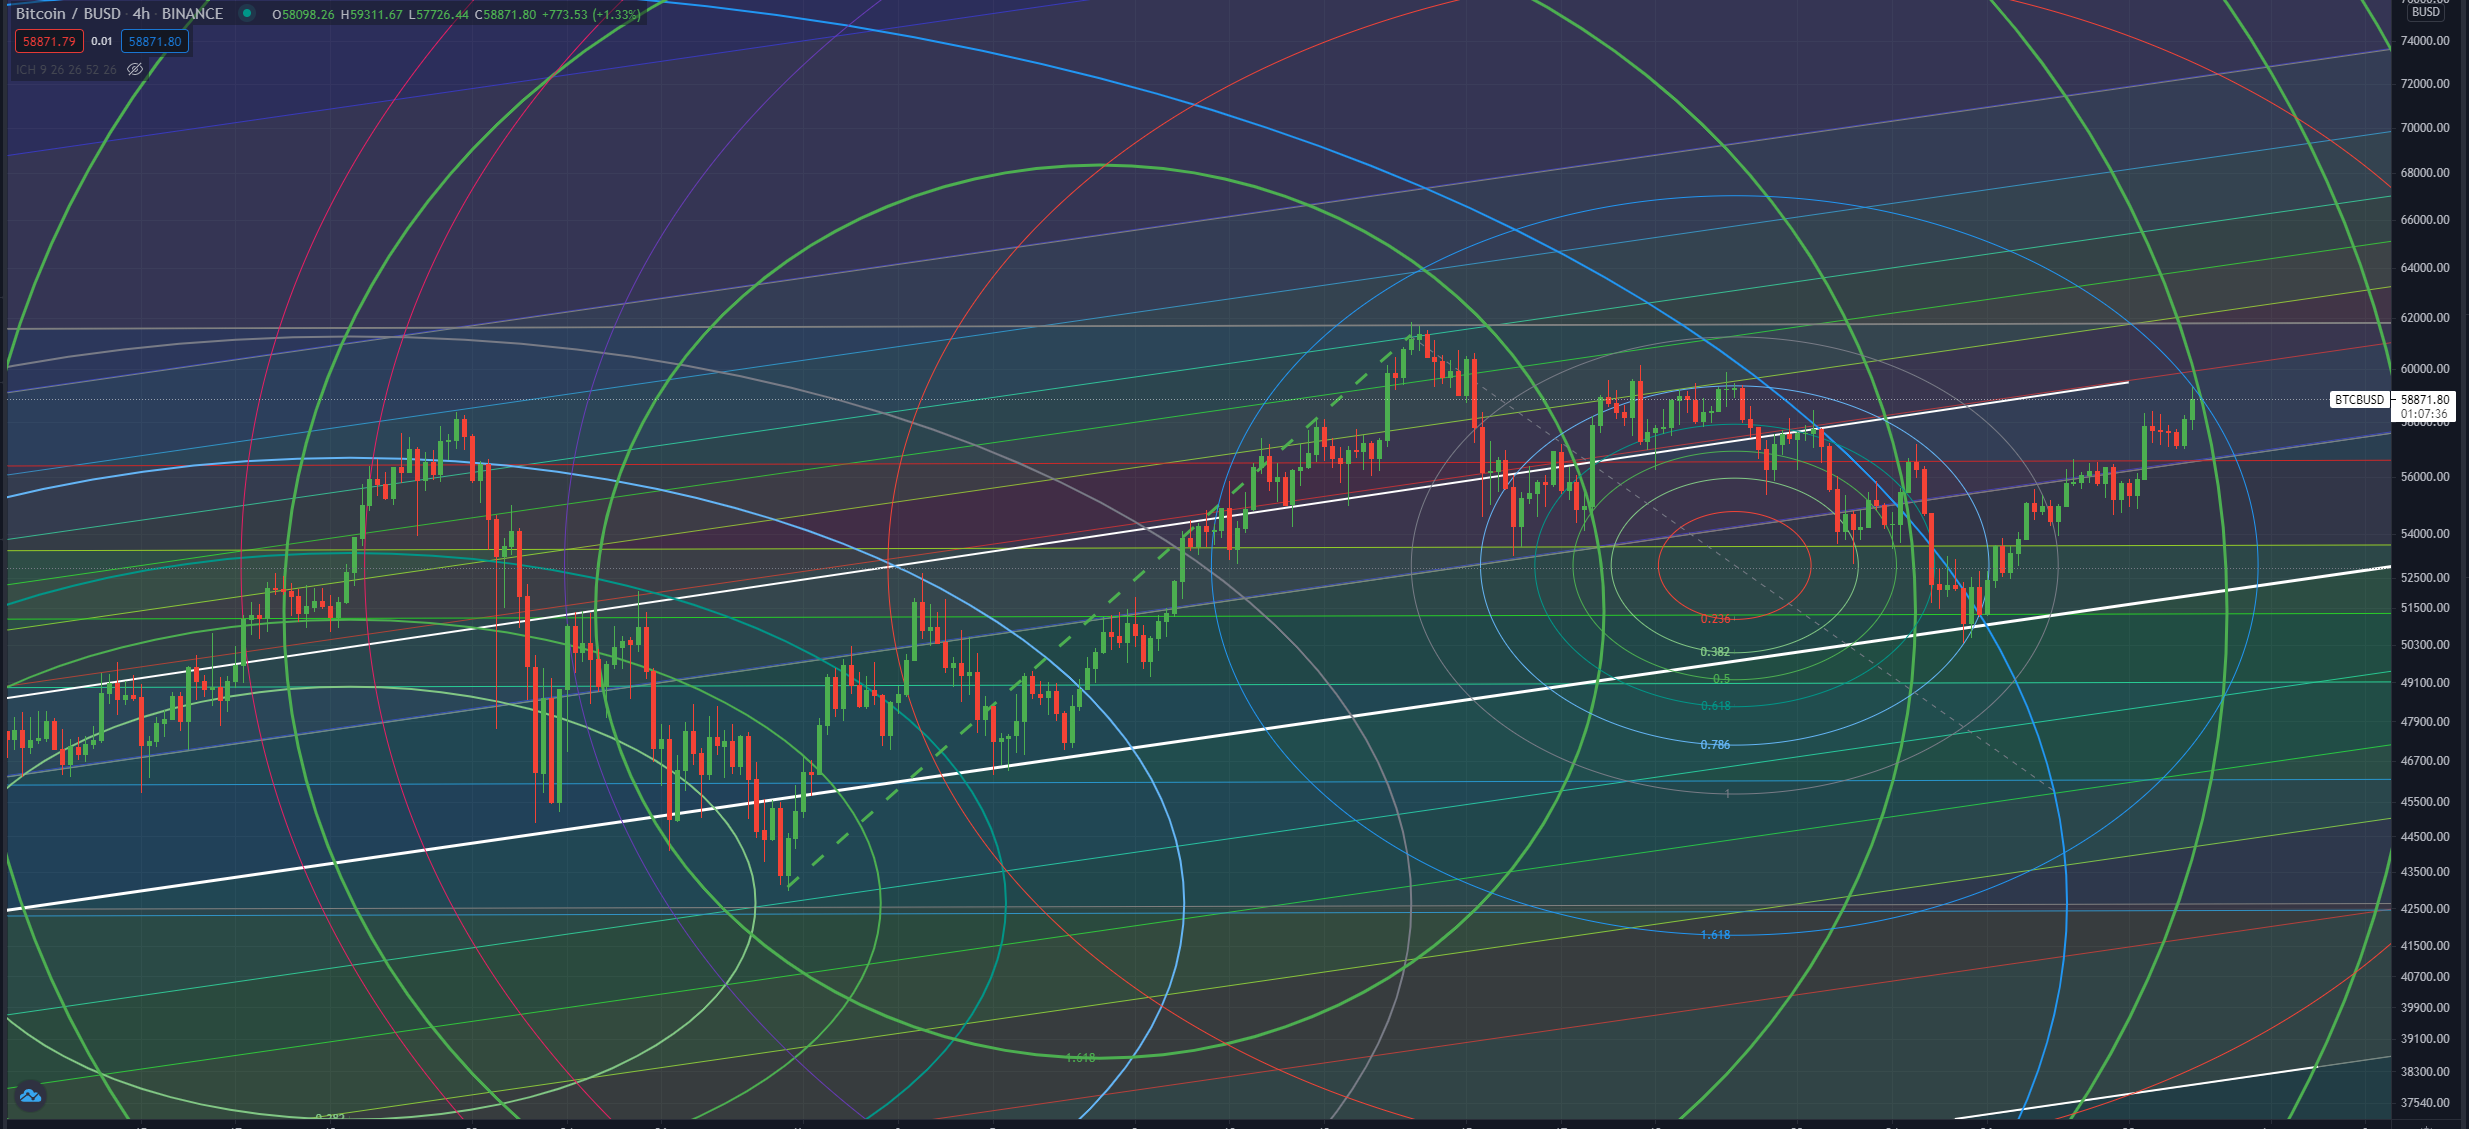
BTC-BUSD 4h Binance:
[IMAGE: https://images.hive.blog/DQmNwvESDWrH919j67a14LJNjnBwDeKCi7rczDB9waEAA2N/image.png]
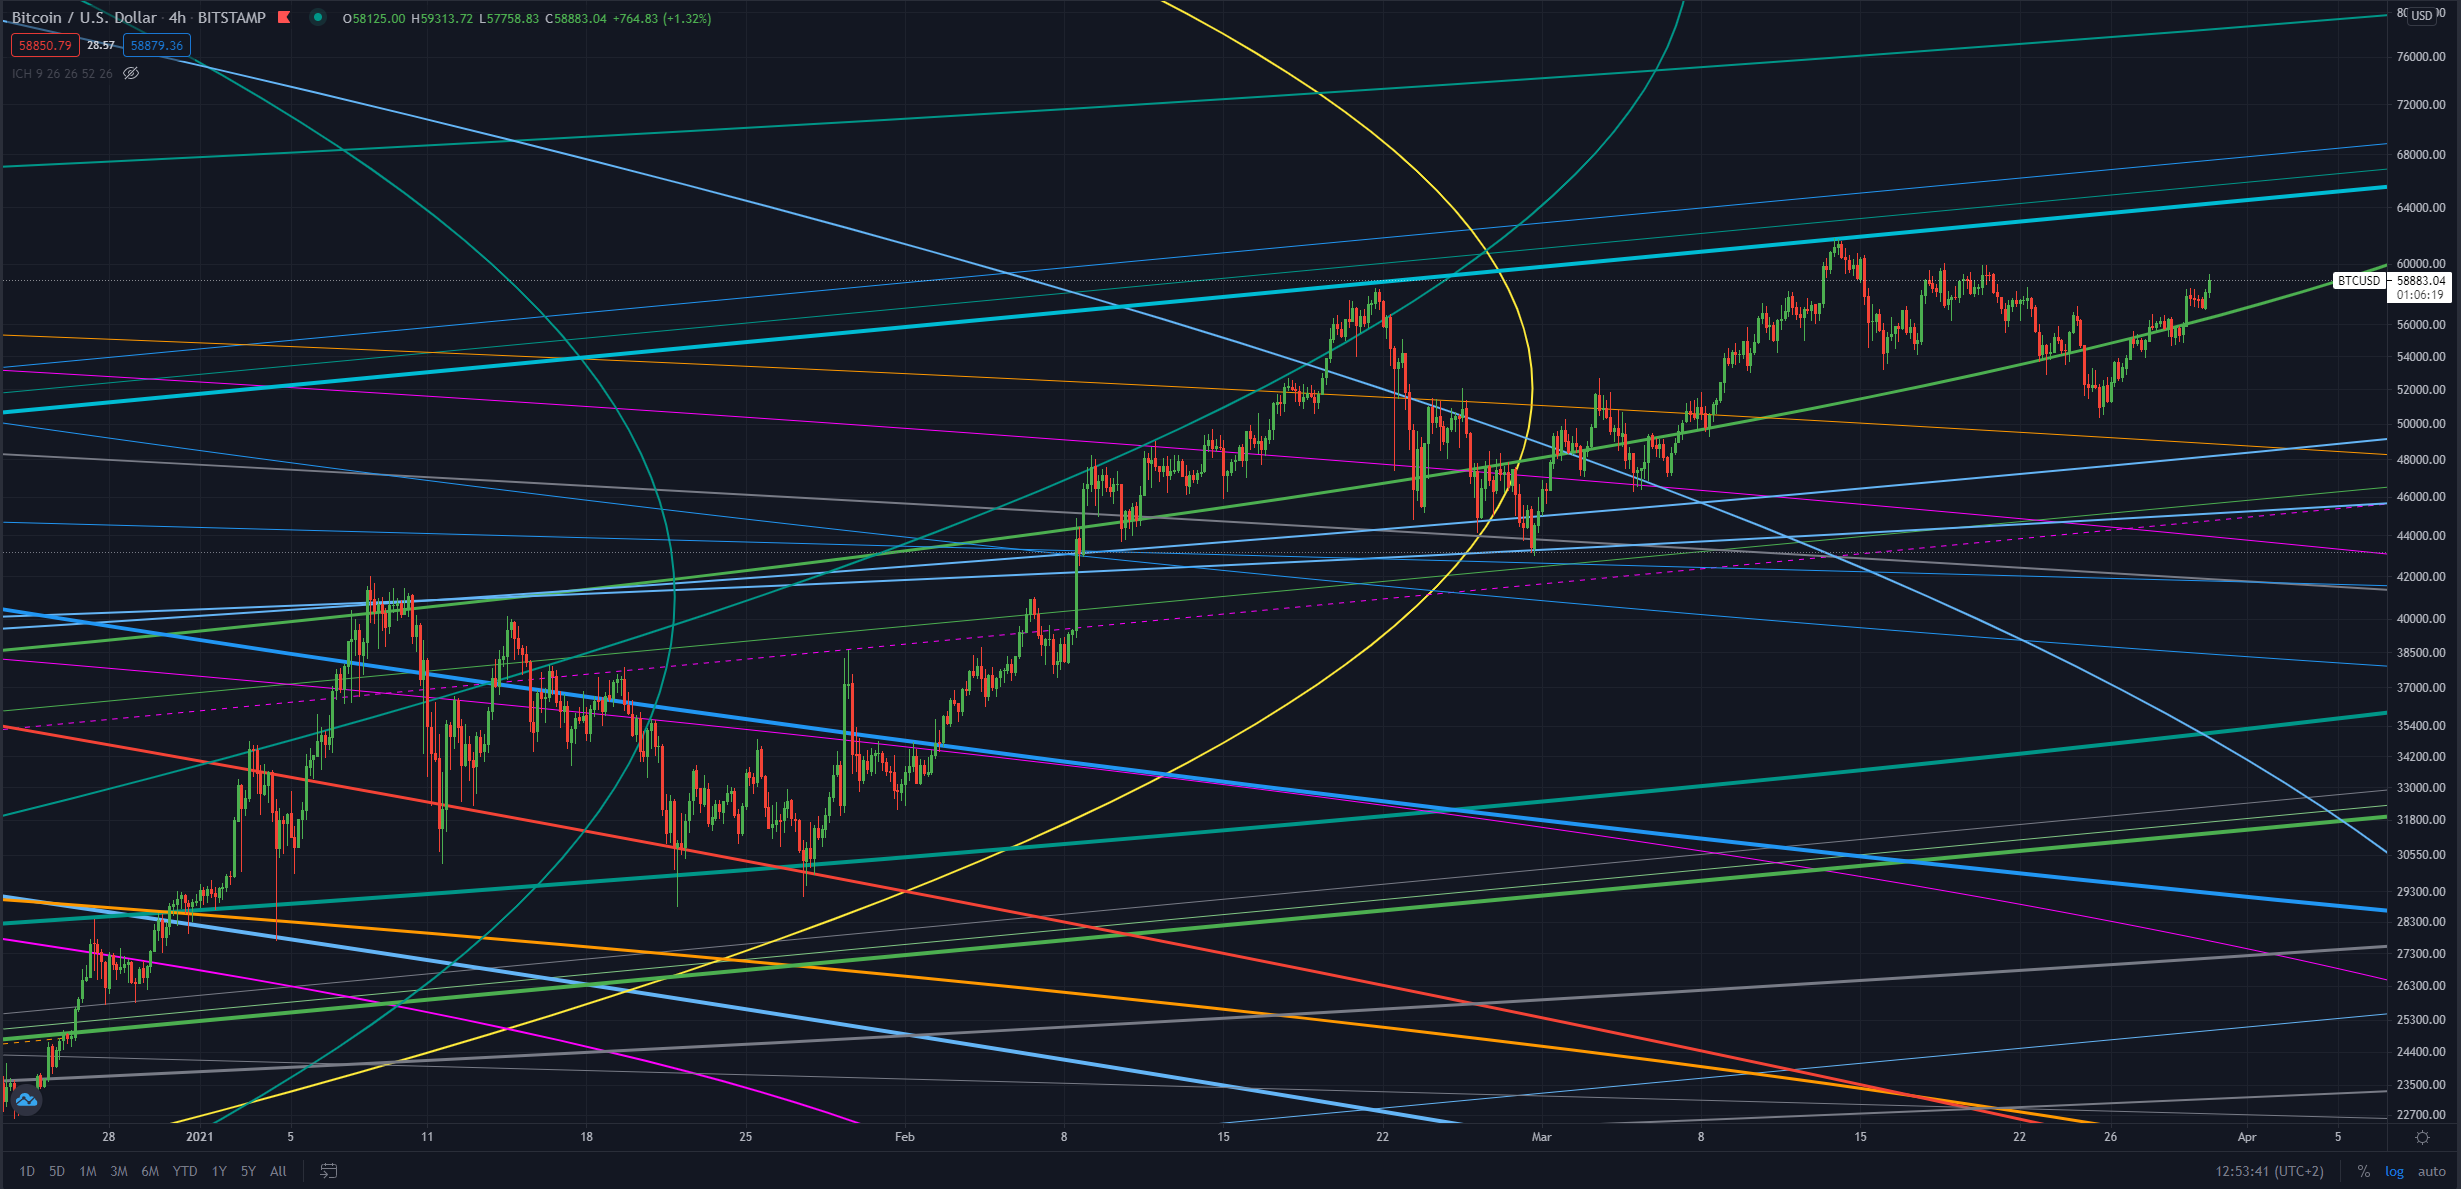
BTC-USD 4h BitStamp:
[IMAGE: https://images.hive.blog/DQmd4j9nJ8qtqCqK8L3KKSvCDYguCNHmwKrM4R586jbWa5W/image.png]
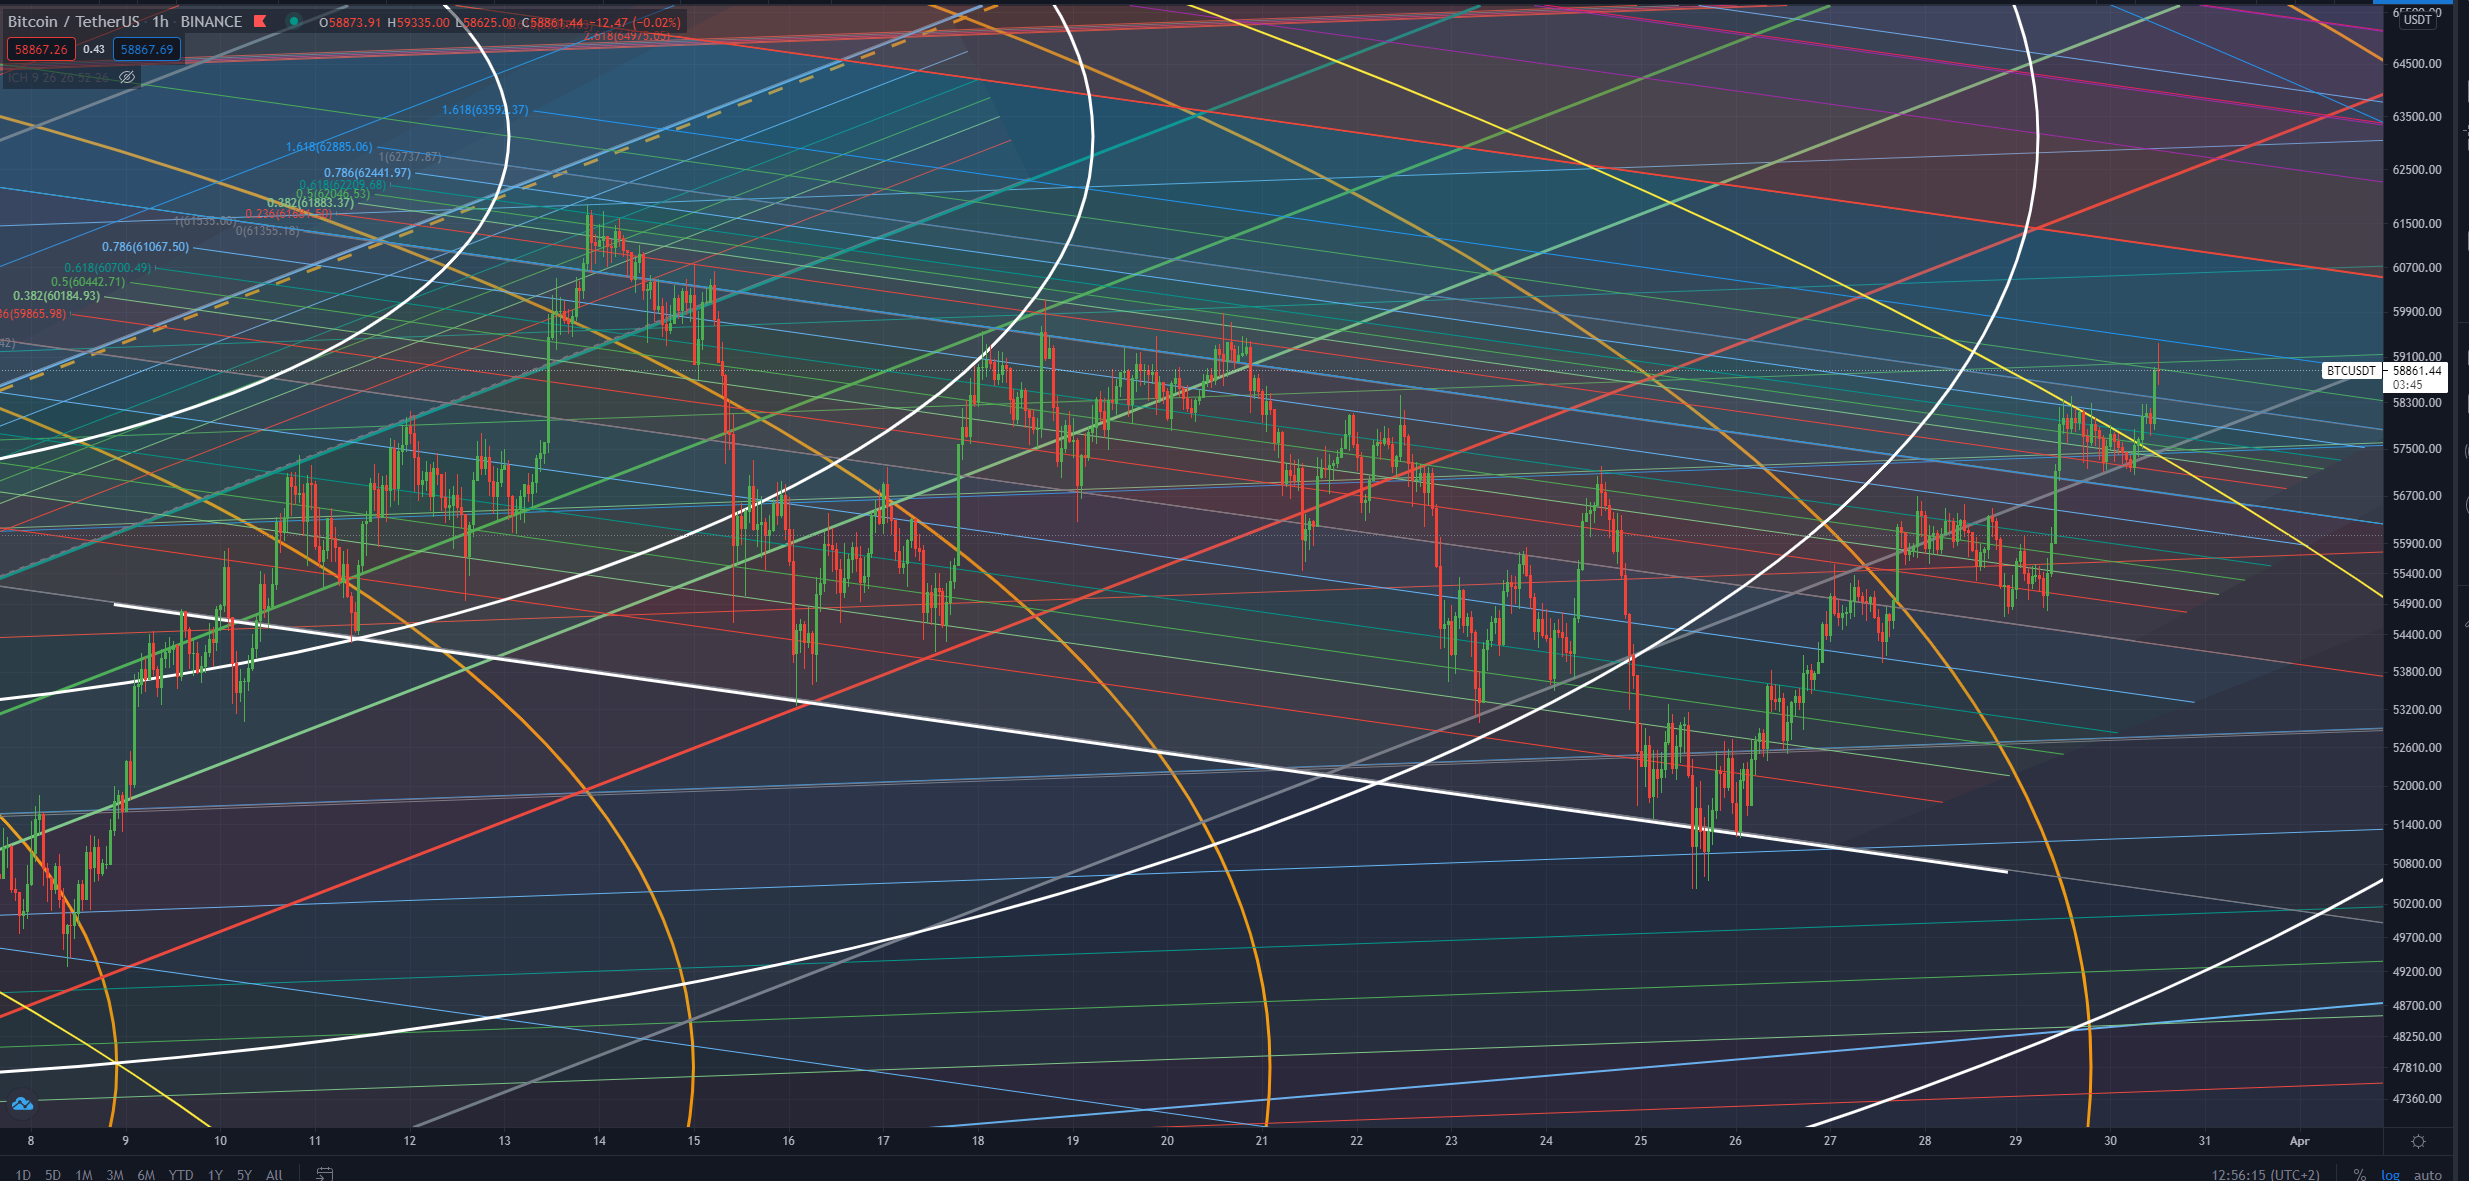
BTC-USDT 1h Binance:
[IMAGE: https://images.hive.blog/DQmQYvXmiuJ2SVJeG2jZ4pyktaMFb9ypAvfNBKaxkNsu3qb/image.png]
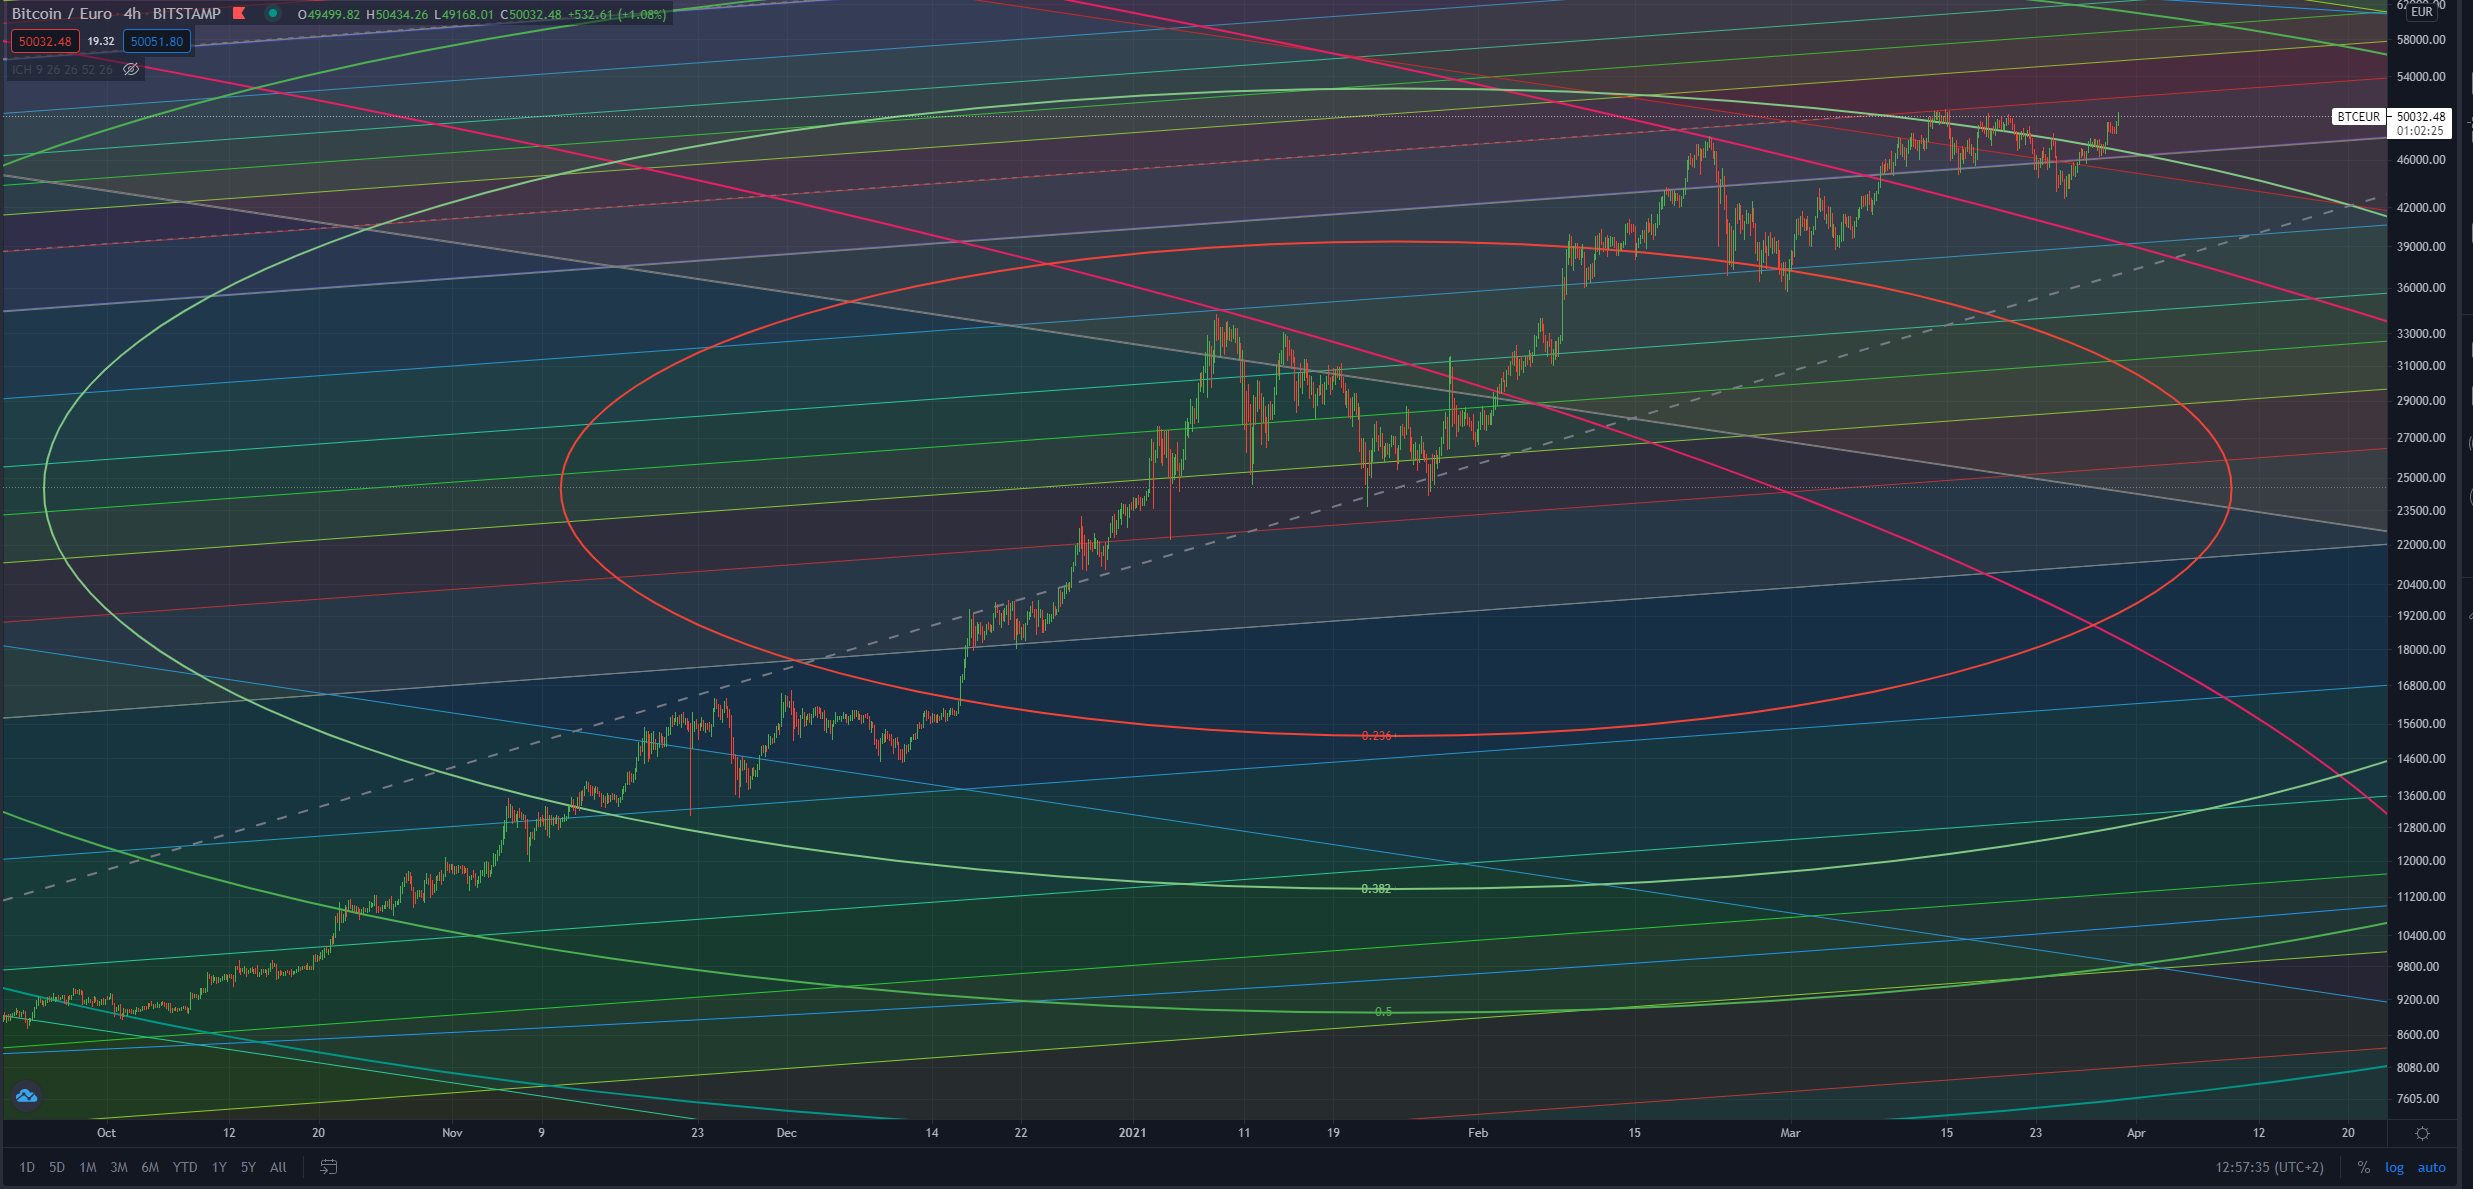
BTC-EUR 4h BitStamp:
[IMAGE: https://images.hive.blog/DQmTgx4o81wuScDTKj4ErtpjRNhxugGXrdAVf3Bqt5X5BAZ/image.png]
and the last one
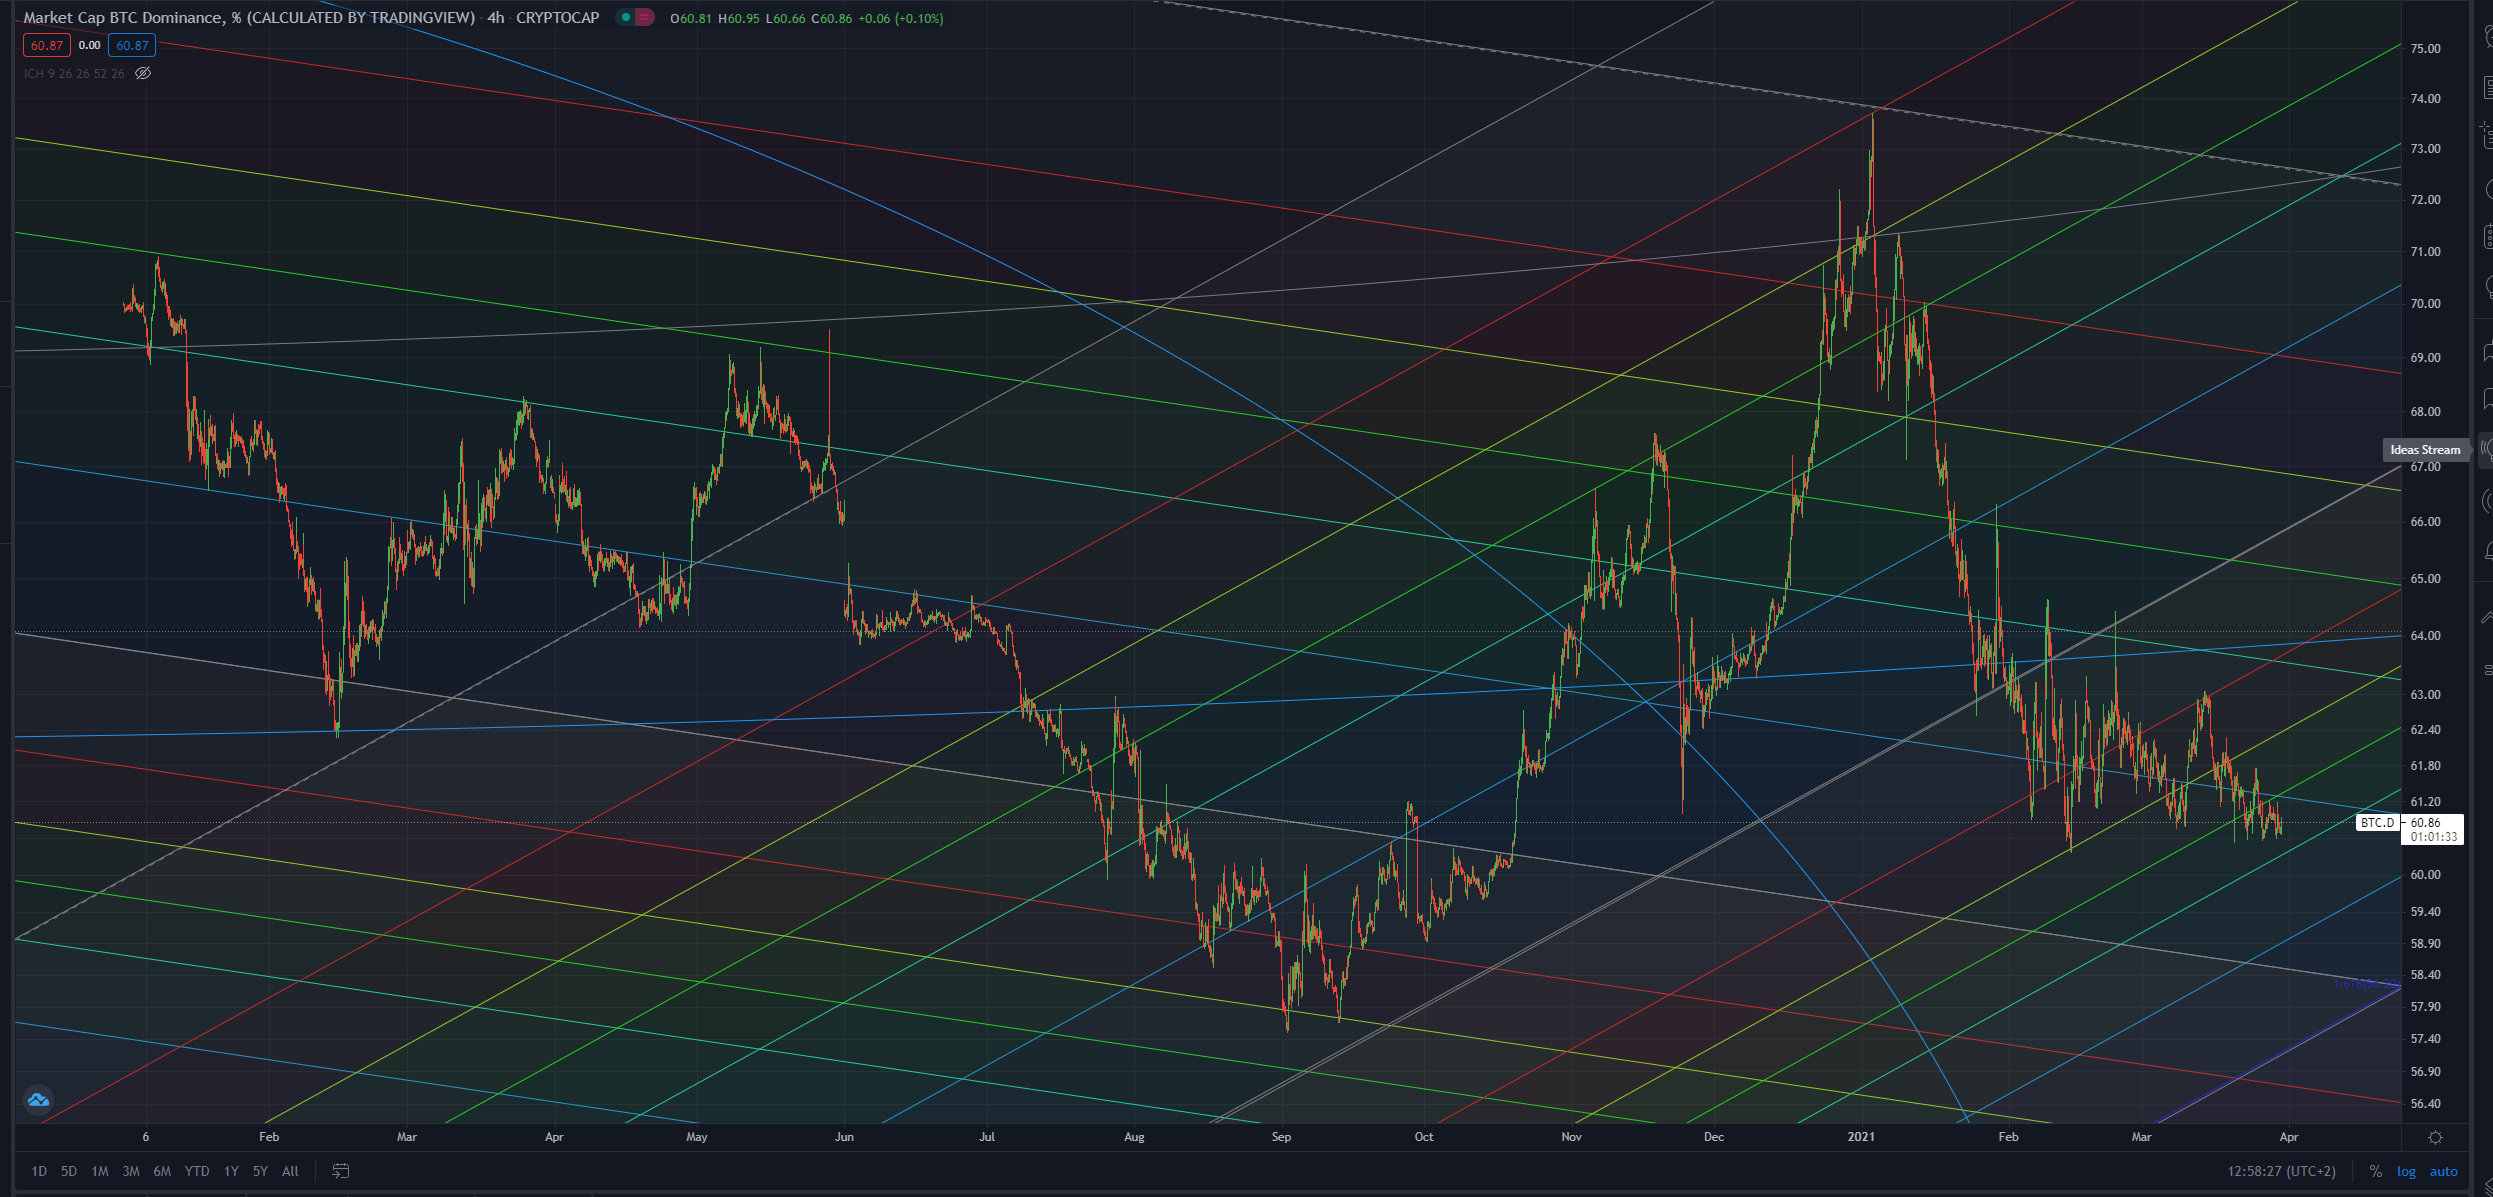
BitCoin Dominance:
[IMAGE: https://images.hive.blog/DQmNT7hPnv7z1Wbj2RGpGYXjv5nVKWyiUsYjECC7nichKQj/image.png]
Posted Using LeoFinance Beta