Several reason (not going to present them here) why I stopped the daily TA summary.
Going forward from here I am thinking of a revival but in a different way - more a summary of statistics and key information - more on a weekly or monthly time frame. How the format looks like in detail - still to be worked out. But I am certain it will be helpful for you guys as well.
Design will be optimized in future.
[IMAGE: https://cdn.steemitimages.com/DQmSimCviaXRDoViaj2Ydd7s1YGbYjXEkKNh1jNt8o19Eak/download.jpg]
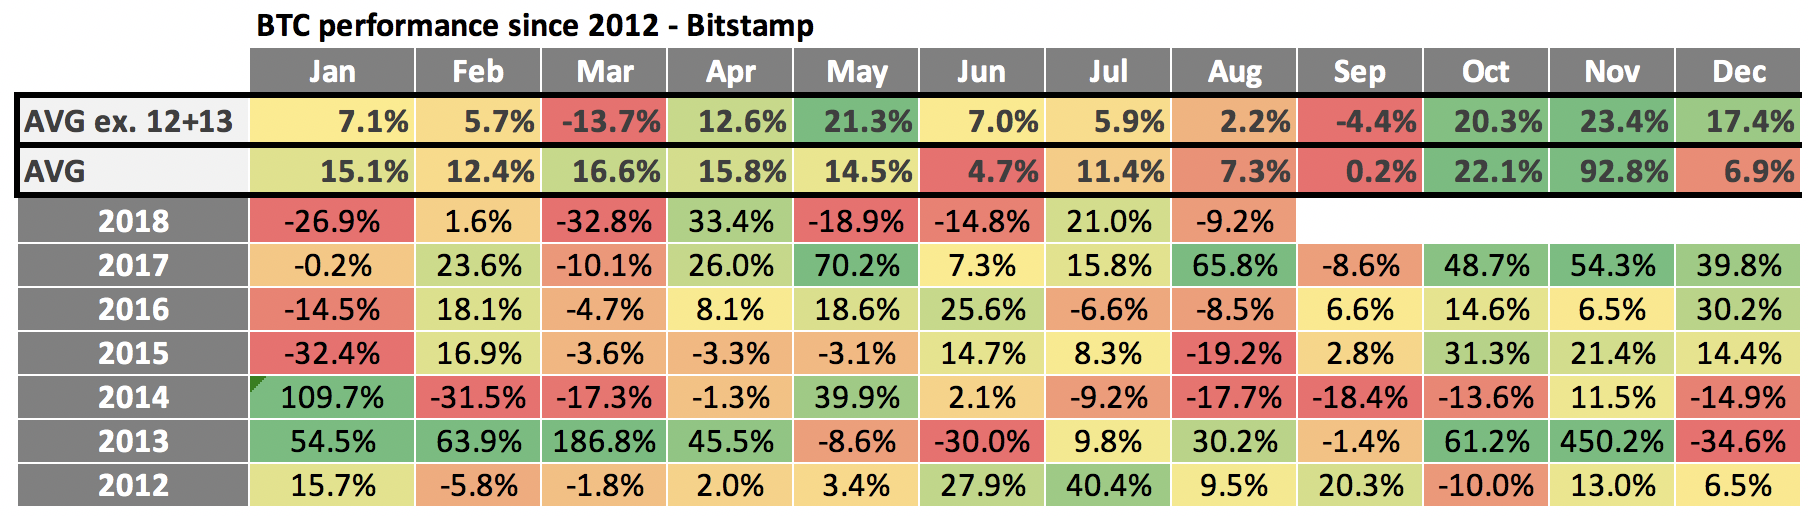
Here we go with the first overview. Monthly performance and quarterly performance for BTC.
I will add information time by time and build up a good structure. Feel free to post suggestions and requests for information to be added.
Crypto-verse statistics
monthly performance:
[IMAGE: https://cdn.steemitimages.com/DQmb9D1Ws2JY39KRZWhErj7mnDJpGP1N4xXqYWsDYtuuaEQ/Bildschirmfoto%202018-09-21%20um%2014.59.04.png]
September: typically a weak month
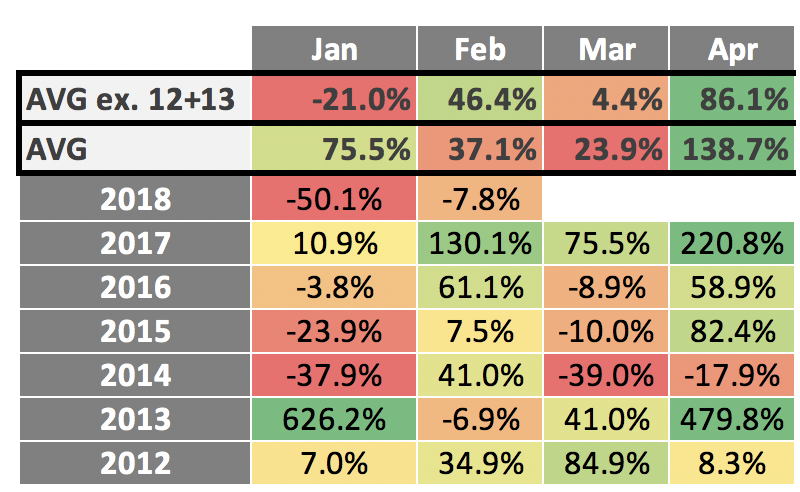
quarterly performance:
[IMAGE: https://cdn.steemitimages.com/DQmfERRhUbJtoqVqW9Yxiiw53kwcX7gTRJJ1VBeucPWvbsk/Bildschirmfoto%202018-09-21%20um%2014.59.09.png]
Q3: weakest quarter statistically.
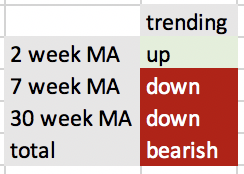
consensio
[IMAGE: https://cdn.steemitimages.com/DQmQaCJrJJ5C6nR8xurB5Pm68HeNeWo6KohqYTxUAVSbzP4/Bildschirmfoto%202018-09-21%20um%2014.59.17.png]
Bear market indicated
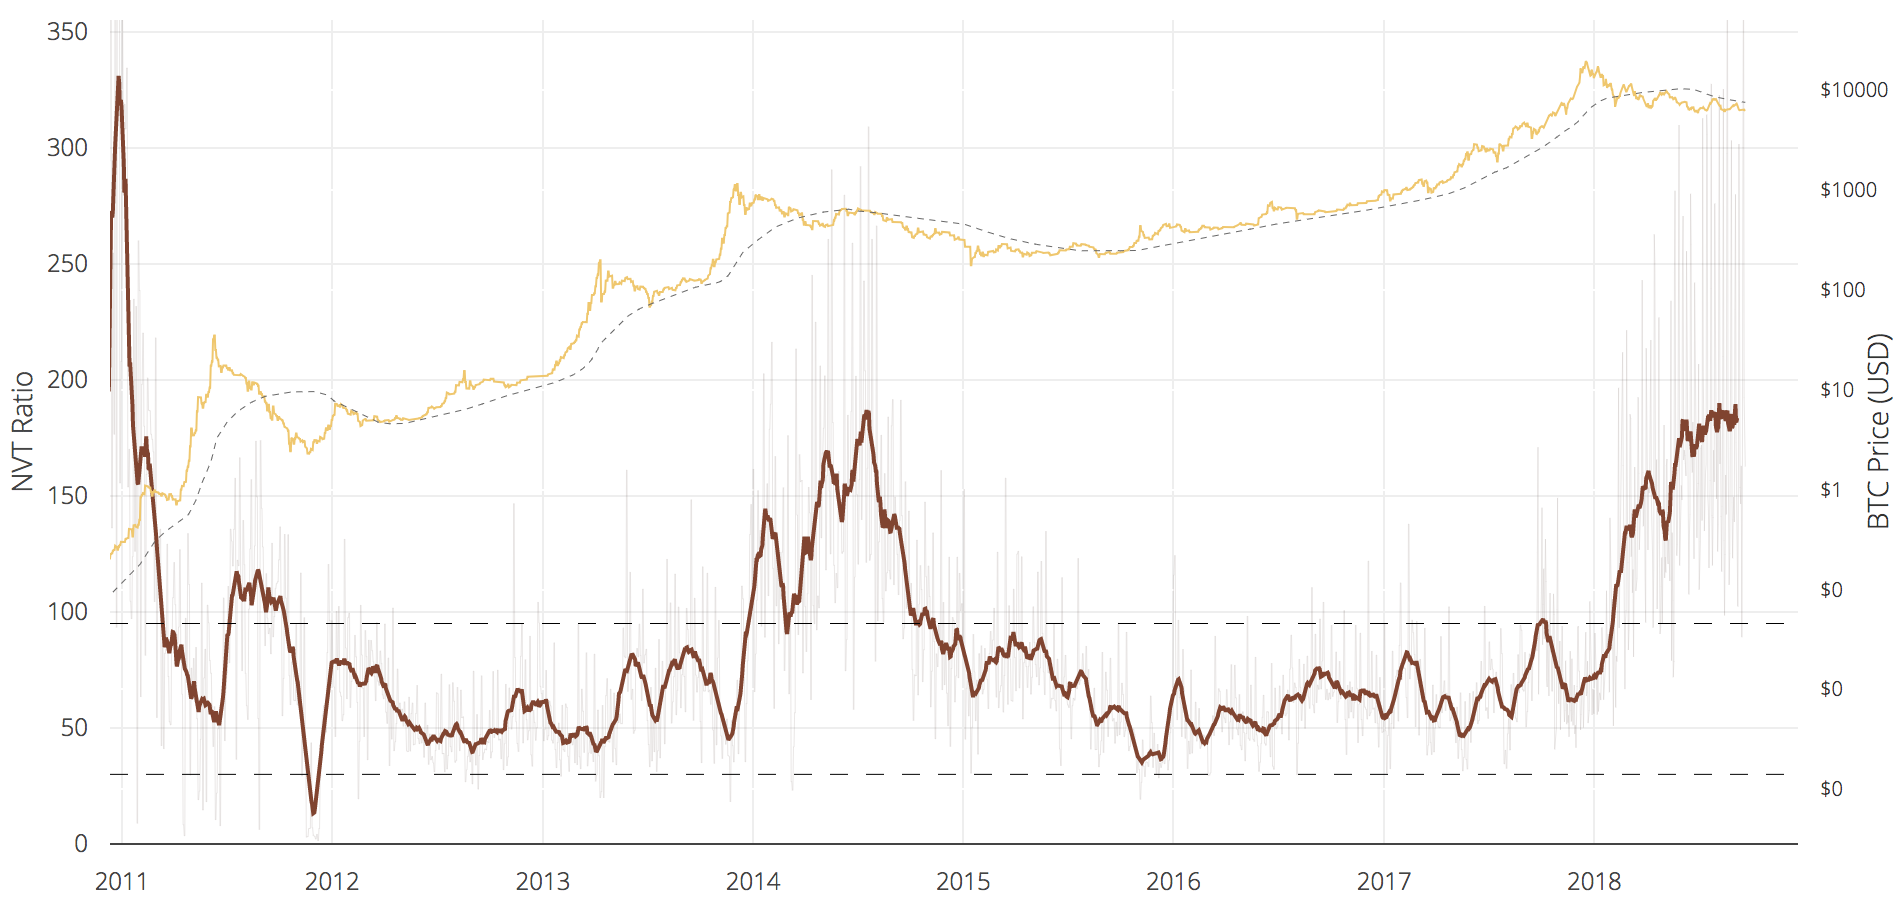
NVT
[IMAGE: https://cdn.steemitimages.com/DQmahzBmAqkKFHynvimDGRxoXYdLjE3cH87xSmfuT2vXsBE/Bildschirmfoto%202018-09-21%20um%2015.00.23.png]
Valuation: "expensive"
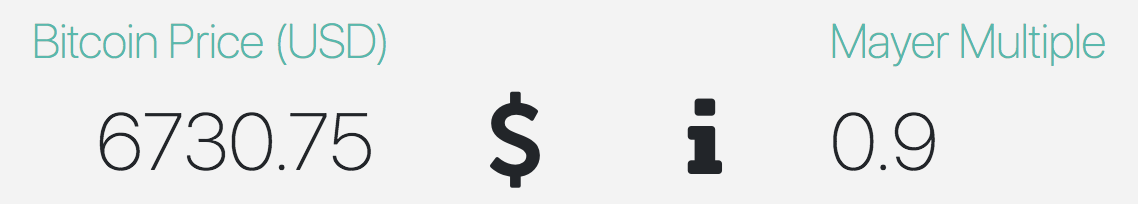
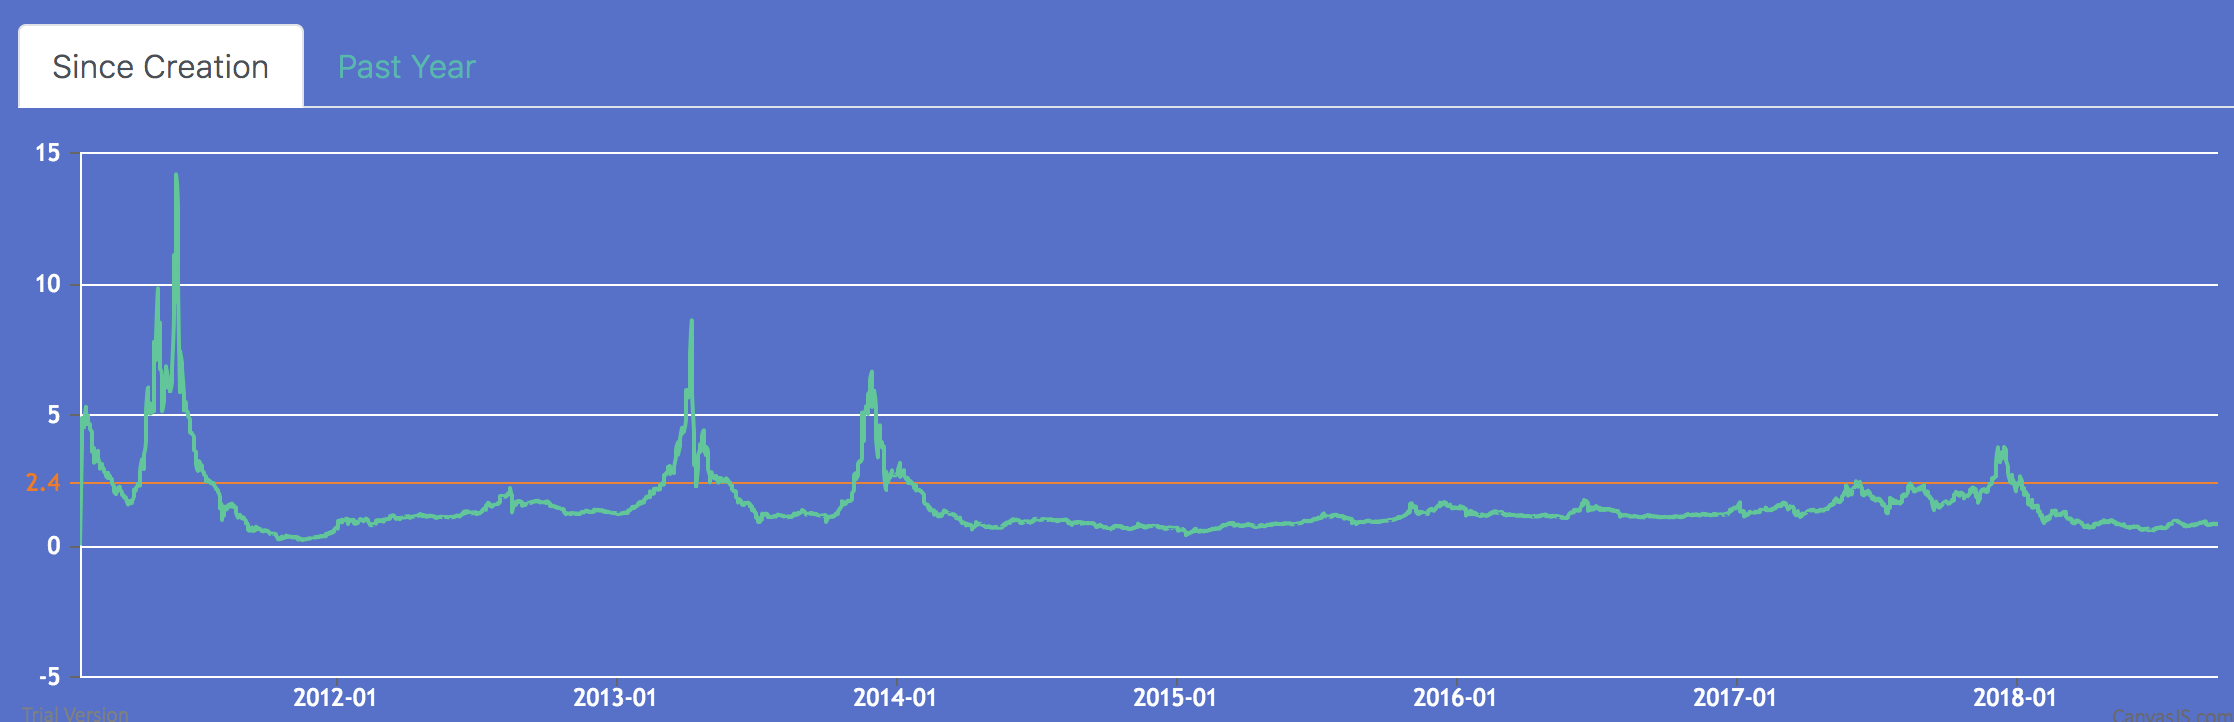
Mayer multiple
[IMAGE: https://cdn.steemitimages.com/DQmdPxxZ9LKU2c2mCZKsgZhveS8LCgb4Sq1dzNAD39suPnp/Bildschirmfoto%202018-09-21%20um%2015.04.10.png]
Below 2.4 x the MA 200 = buy signal.
long term
[IMAGE: https://cdn.steemitimages.com/DQmU7R1f9ujeCwW7M4FcCryciVLnDZfjLvqy6hwMpXgzEde/Bildschirmfoto%202018-09-21%20um%2015.04.03.png]