SUMMARY
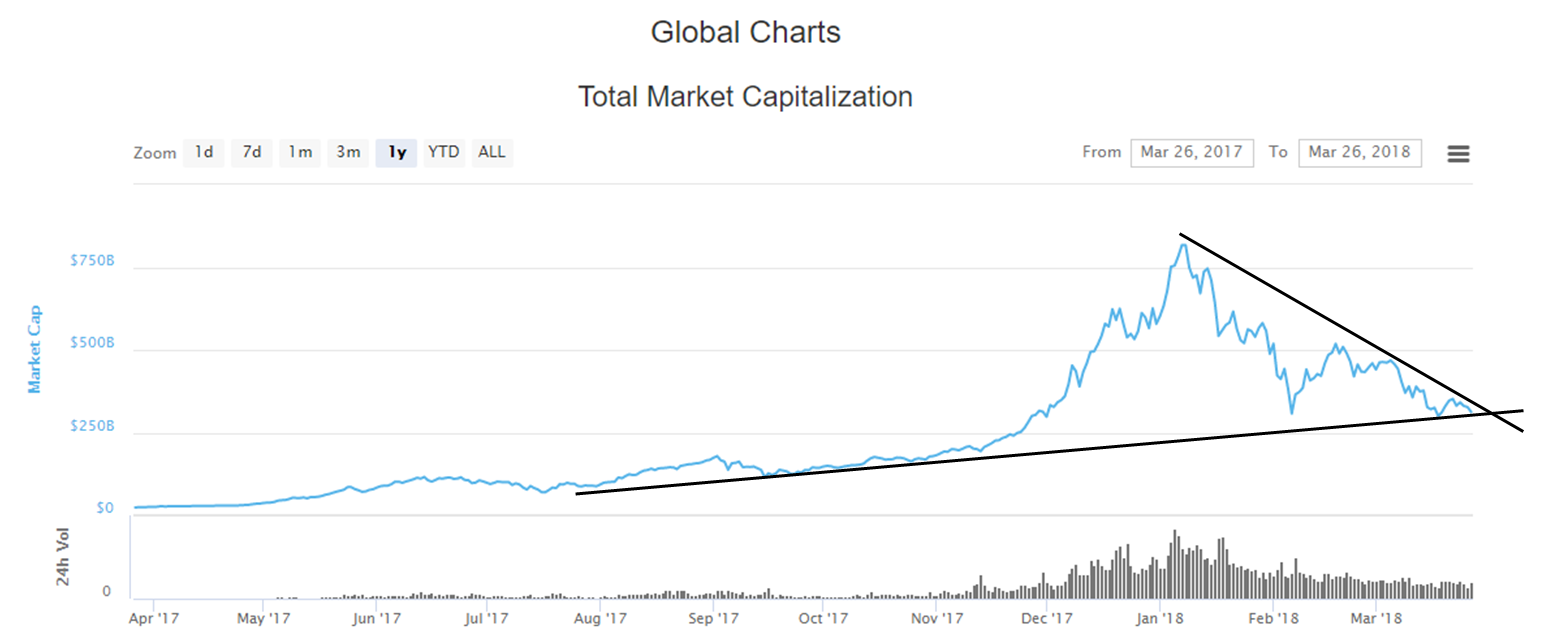
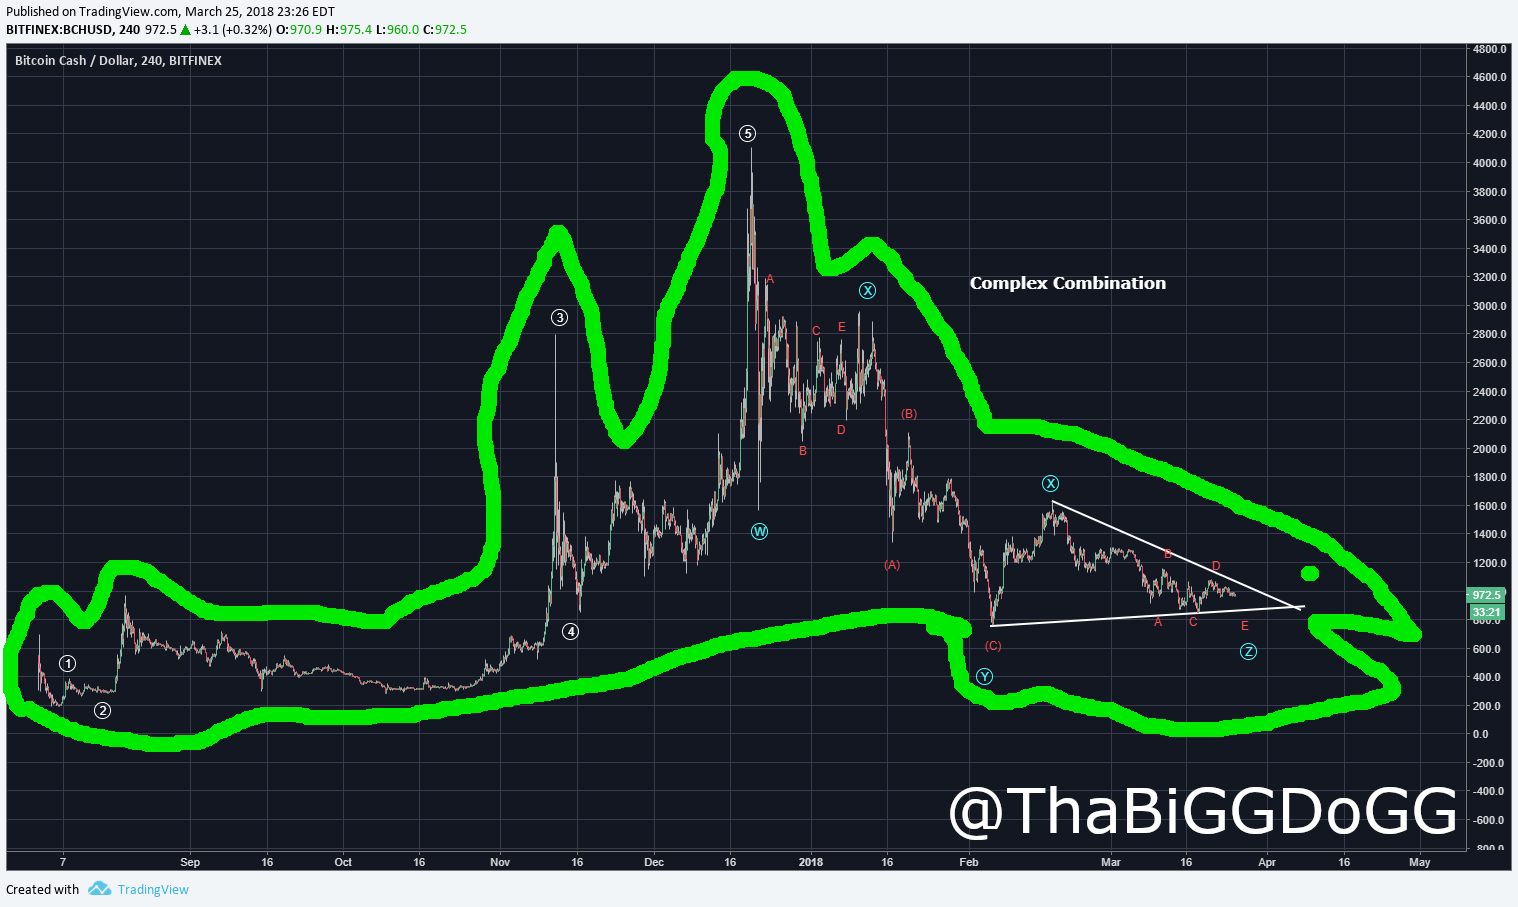
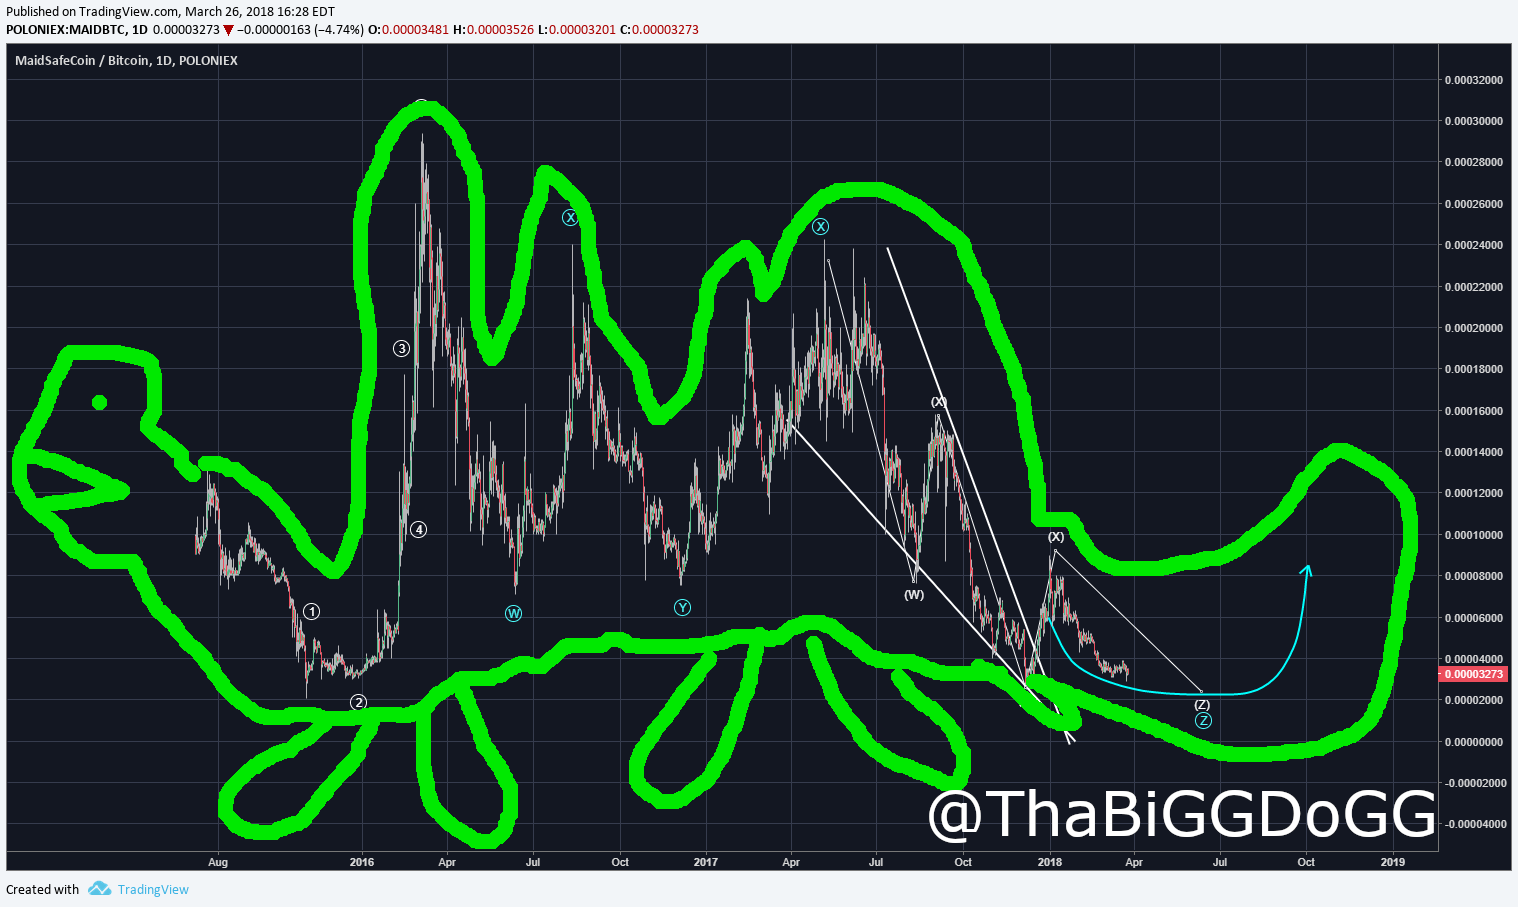
The total market capitalization of all listed coins can be charted as shown below. The symmetrical triangle line drawn shows a potential for a critical juncture. The apex, or the point at which the two lines intersect is very proximal to current price. This means that volume is low and price is waiting for release from the confines of the contracting lines.
[IMAGE: https://steemitimages.com/DQmWWvmiAaw6Z6BQ7keoirF37PCQ9SfH93XQuYHXuxS2Uga/image.png]
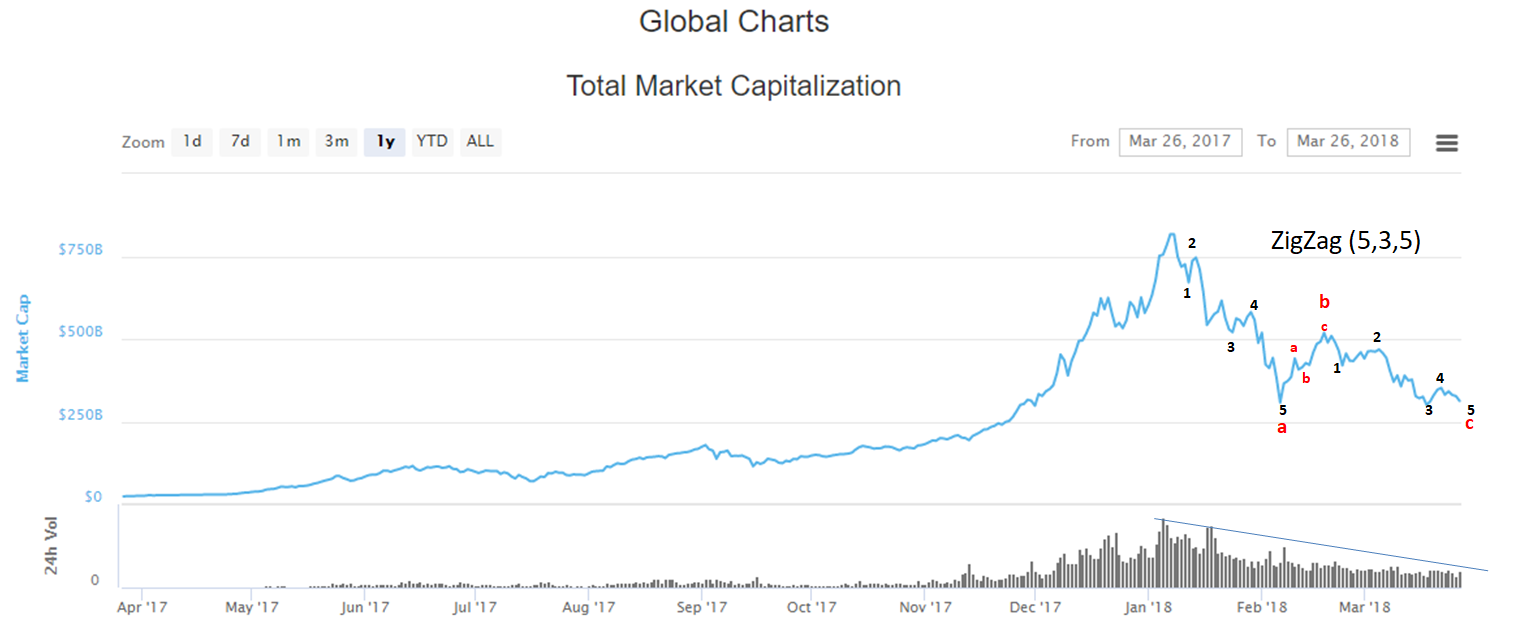
The key question is as to which direction the breakout is likely to occur. Elliott Waves show that the correction is probably a ZigZag (5,3,5) type. Note the red abc and how red A has five subwaves. This is what marks it a ZigZag. The red B wave has three subwaves, red abc. The final red C wave also shows five subwaves. Wave 5 is likely not yet complete and so an incremental lower low is likely. However, beyond that, this ZigZag can technically be considered complete. So, if ABC correction is complete; what happens next? A breakout to the upside is the most probable outcome after the final wave 5 of C completes and that can be any moment.
[IMAGE: https://steemitimages.com/DQmRujpfRGBCrGnBiPEAzkhQTdA6aXZXZ2TGB331w3oPK3F/image.png]
Legal Disclaimer: I am not a financial advisor nor is any content in this article presented as financial advice. The information provided in this blog post and any other posts that I make and any accompanying material is for informational purposes only. It should not be considered financial or investment advice of any kind. One should consult with a financial or investment professional to determine what may be best for your individual needs. Plain English: This is only my opinion, make of it what you wish. What does this mean? It means it's not advice nor recommendation to either buy or sell anything! It's only meant for use as informative or entertainment purposes.
Please consider reviewing these Tutorials on:
Elliott Wave Counting Tutorial #1
Elliott Wave Counting Tutorial #2
Elliott Wave Counting Tutorial #3
Laddering and Buy/Sell Setups.
Laddering Example with EOS
Tutorial on the use of Fibonacci & Elliott Waves
@haejin's Trading Nuggets
Essay: Is Technical Analysis a Quantum Event?
Follow me on Twitter for Real Time Alerts!!
Follow me on StockTwits for UpDates!!
--
--
https://steemitimages.com/DQmWpisRXDF56mV3DgzzPUxb3R2ozseR48YVr2YKtwtrBcV/DQmWpisRXDF56mV3DgzzPUxb3R2ozseR48YVr2YKtwtrBcV.gif
https://steemitimages.com/0x0/https://s1.postimg.org/231h83mh7z/U5drx_NFe_Q4_Nn_YGEb9rq2_V47_X6_Yk_AQsm.gif
People are hungry for cheap BTC--if it breaks 6k and price can inch itself toward 5000-4800, it would take some impressively bad news to push it beyond that price depth. Too many buyers ready for BTC in that sub 6k range. All my signs say that we may face another 4-5 weeks of dips/sideways movement (maybe), but we will see things blast off by May. Crypto is an all together different animal compared to 2013, this correction will not be drawn out too much longer.
@mdkaufman21, @haejin has indicated that BTC trend (Down Wave 5 of C) will likely complete with incremental lower low of ~ 7.5 to ~7.2 (now). If BTC goes below 5.9, a much lower dip is likely (~ 4.5, 3.8, 2.8 not out of the question esp if WXYX2Z pattern that @ew-and-patterns warns about happens).
Or maybe sell 1/3 now and buy back if it does dip lower. (if it dips, you'll make a larger multiple on that 1/3). If it moon shots, you'll do well with those 2/3s...
I am not doing that. Mostly because I have a lot in Raven, and that's exploding right now. But it'd be a more conservative approach to what you mentioned.
Seriously @thabiggdogg. At first I was a wide eyed rookie and believed everything he said, because it was a bull market and he couldn't be wrong...but after following him for months into the bear and gaining more experience, anyone with even small brain capacity could see that he just puts numbers and lines on a chart and says the opposite from day to day, and pays himself out in astronomical proportions. Fucking quack.
That's right. Anyone can make charts like his. All his is doing is just showing what's its done. Then he will draw a line showing it going get a big gain. No one knows what it will do. It depends on so many things. Governments, networks, people mining it, & etc. Its not like saying GM production plat caught fire. And it won't produce as many cars this money. I'm sure their stock price might take a hit then. Haejin has never talked about anything else. All he is doing is trying to pump up some shitcoins so he can sell them when his some of the dumb followers he has buys them.
If he was REALLY that good, why hasn't he ever shown a picture about himself. Why isn't their any details anywhere about who this person is? I know why... Because he is a SCAMMER.
Congratulations, your post received one of the top 10 most powerful upvotes in the last 12 hours. You received an upvote from @ranchorelaxo valued at 124.95 SBD, based on the pending payout at the time the data was extracted.
If you do not wish to receive these messages in future, reply with the word "stop".
Congratulations @haejin, this post is the sixth most rewarded post (based on pending payouts) in the last 12 hours written by a Superhero or Legend account holder (accounts hold greater than 100 Mega Vests). The total number of posts by Superhero and Legend account holders during this period was 45 and the total pending payments to posts in these categories was $2149.31. To see the full list of highest paid posts across all accounts categories, click here.
If you do not wish to receive these messages in future, please reply stop to this comment.
Something you have to know about Market Cap!
If you ever wondered how the market cap could rise with 3 billion dollar in only half an hour and are thinking that 3 billion dollar is "new" money coming in, you're wrong!
To keep it simple I rounded the figures and made them smaller:
Let's say BTC has 17 million coins circulating at a price of $ 10,--.
The market cap would be 170 million.
At the moment that 5 BTC coins would be sold for $ 20,-- the whole market cap would double to 340 million while in reality only $ 50,-- of new money came in.
That's the reason of the big fluctuations of the Market Cap.
It's only a value, not real dollars!
_LI.jpg)