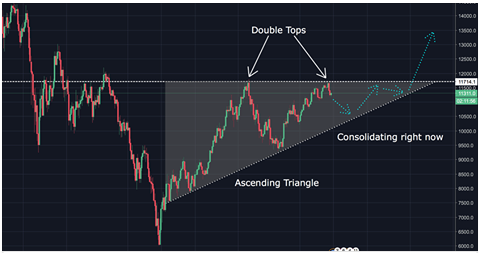
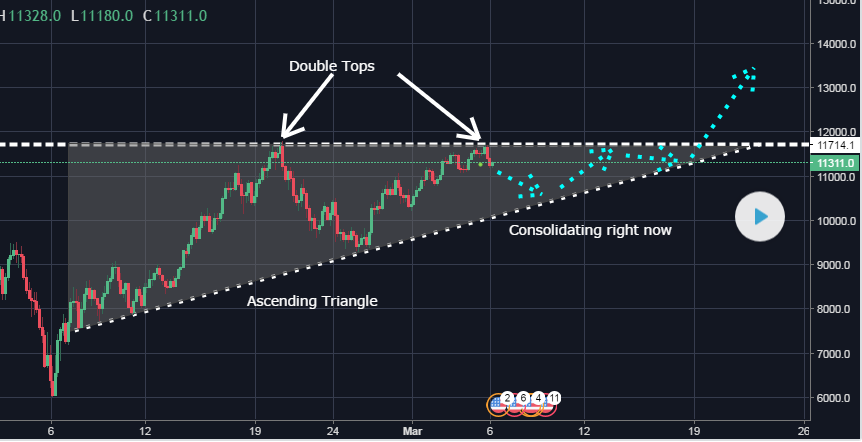
BTC is forming double tops at $11,714. Its currently in the shape of a "ascending triangle".
An ascending triangle is a bullish chart pattern used in technical analysis consisting of a horizontal trend line at a level that it has historically prevented the price from heading higher .
If BTC breaks the $11,714 mark, potentially we will see it breaking out to 12200
But before it breaks out, it might correct slightly.
[IMAGE: https://steemitimages.com/DQmUnRehLFbt4PS4AF9THLj9WsEdjhnxdS2piQ1sKTq9z8q/image.png]
[IMAGE: https://steemitimages.com/DQmYk2wtdbVEPwVC3zMegqnyqf85siRBtkkFzYetpdgctZe/image.png]