So, what is the chart telling us?
-
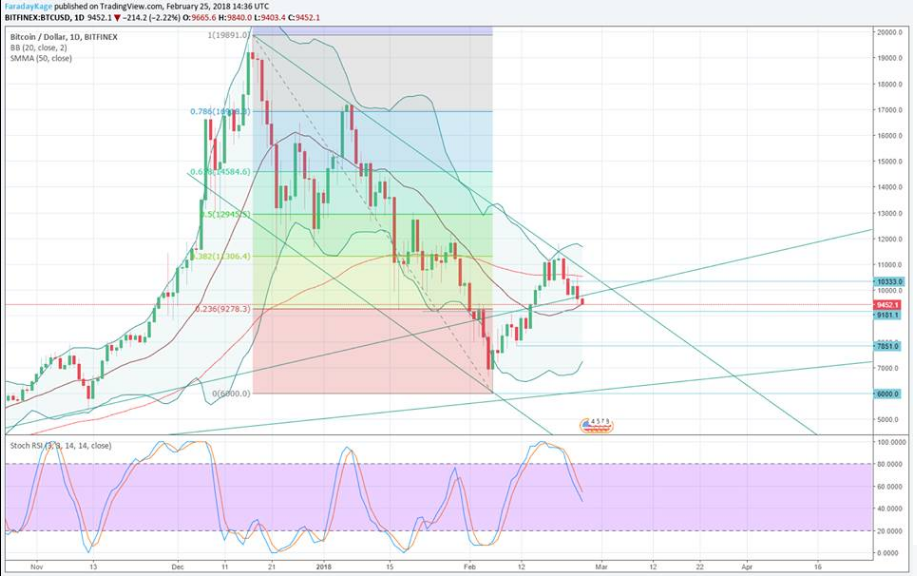
We have busted down through an old uptrend line from October, invalidating the uptrend already.
-
We are still in the downtrend channel we have maintained from 20k downward- and we recently bounced off the top of the channel.
-
Stoch RSI is high-ish and falling. So the momentum has swung from buying to selling and it seems bears are not out of steam yet.
-
We are currently testing the 20 day average, which is the middle line of the Bollinger Band. It is currently serving as weak support.
-
We recently bounced off the top of the band, and as you can see the bottom is somewhere between 6k and 7.85k- I believe the bottom will move up a bit more.
-
The old 2016/17 uptrend line may be our bottom, but it has not been tested at all yet. If we break down through 7850/7750, I would expect that we will test this line.
Conclusions?
I believe we are still going down, and we need to get into the 9278-9150 zone to see if that support area will hold. If this area fails to hold, the next downward target will be the 7850-7750 zone. After that, the old uptrend line, which will be around 6800-7000.
[IMAGE: https://steemitimages.com/DQmdCbELL8ArxxuufkTQ8mHfYDiTM4NCx868xRbEkzRSop2/image.png]
Help to upvote to give me some moral support