Hello Crypto World.
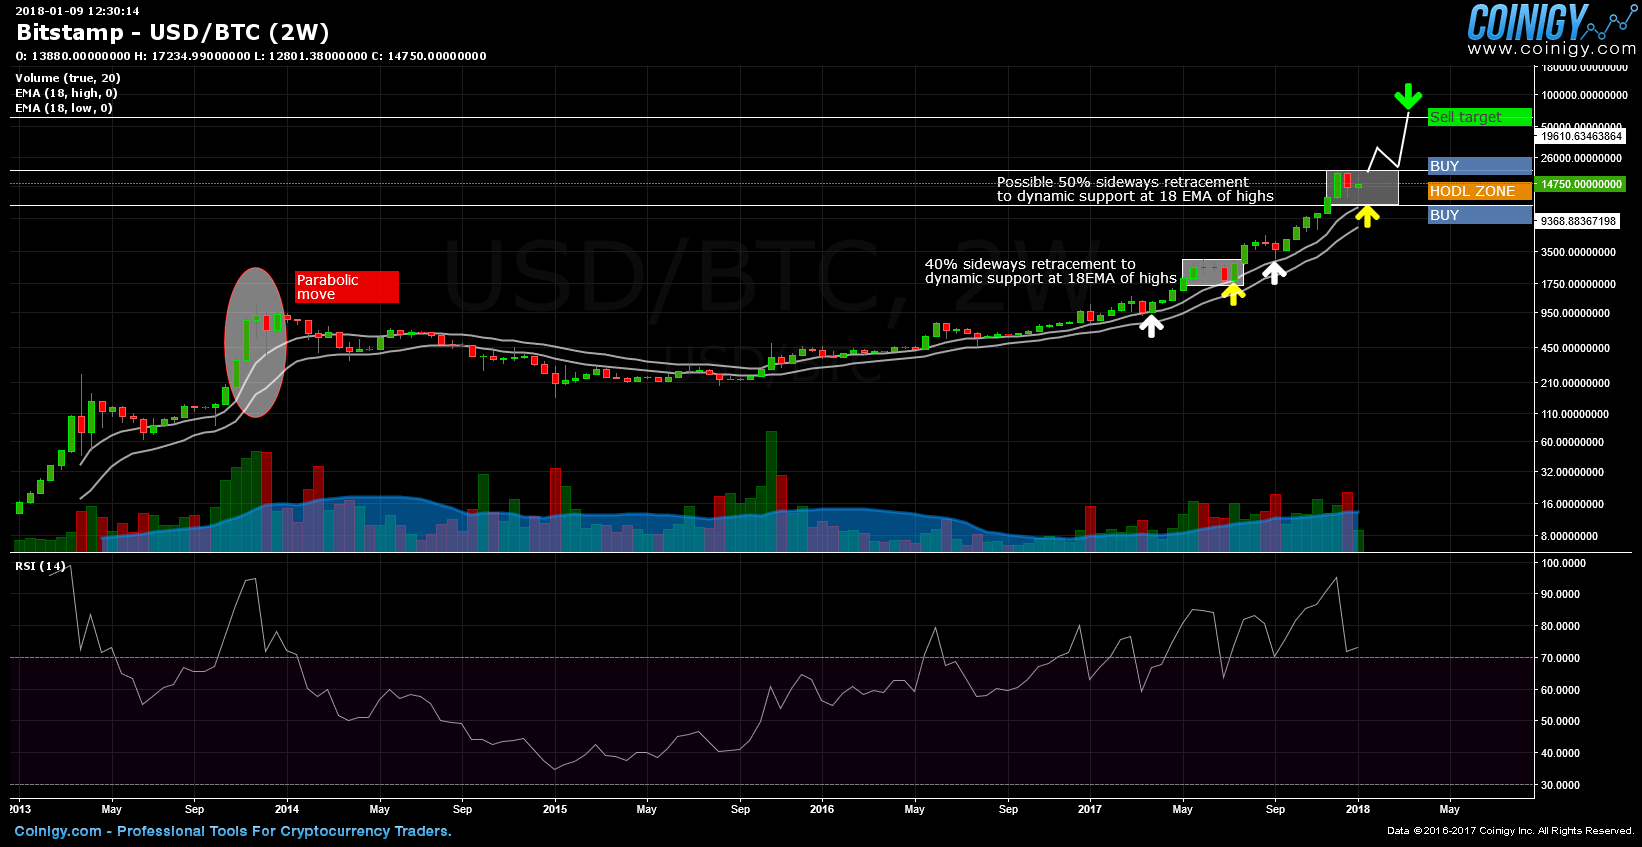
Welcome to my first steemit post. As always, there is a lot of FUD going around. I find that during these times it is a good idea to take a step back to put things into perspective. I am sharing my work on the BTC/USD 2 week chart that I put together to try and stop myself from freaking out. Here is, (in my opinion) what is likely to happen if this trend continues.
-The 18EMA of highs has acted as dynamic support on several occasions.
-We are still extended in this regard after the huge run.
-Retracement to the 18 of highs would take us down to the $9k to $10k region.
-A move to ATH could see us run up to the $60k area mid year.
-A break of dynamic support could take us down to the $1k region.
I think it is much more likely that we see $60k BTC in the near term followed by a parabolic move to crazy highs before the trend changes.
Thank you for reading my first post.