____  ___    _  _     _   _ _____     _______
 / ___|/ _ \  | || |   | | | |_ _\ \   / / ____|
| |  _| | | | | || |_  | |_| || | \ \ / /|  _|
| |_| | |_| | |__   _| |  _  || |  \ V / | |___
 \____|\___/     |_|   |_| |_|___|  \_/  |_____|

 --- A GOPHER-LIKE INTERFACE FOR HIVE BLOCKCHAIN ---

Bitcoin Chart Analysis

BY: @nobin | CREATED: Feb. 12, 2018, 5:38 p.m. | VOTES: 2 | PAYOUT: $0.00 | [ VOTE ]

Hello guys, I'm showing you today's bitcoin/usdt live chart analysis.

[IMAGE: https://steemitimages.com/DQmcv6bMSZSW68pTYdMKwKkTYZXwRZ1c4ejuS1iUXXKqoku/btc.JPG]

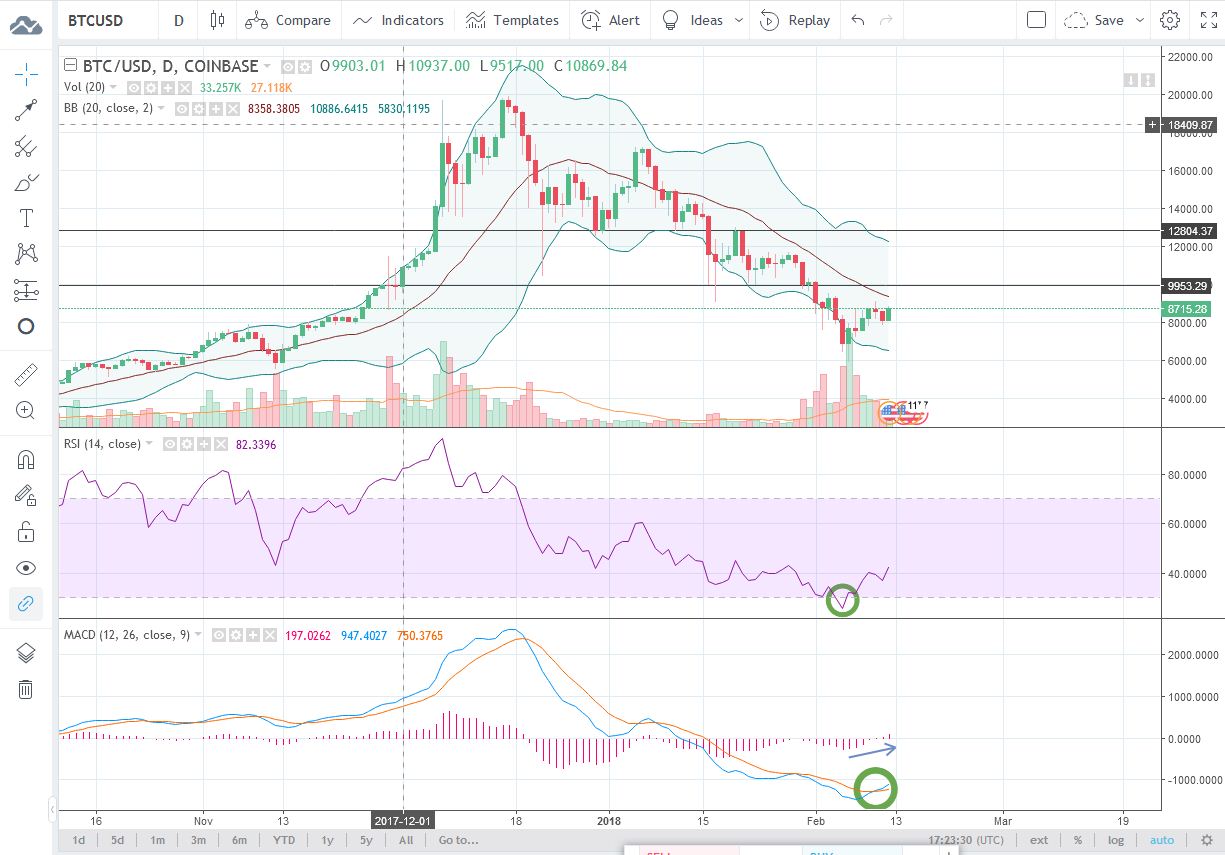
I noticed that, in 1 day chart macd has crossed and rsi is bouncing from over bought zone. The bitcoin market is going to bullish but, first it has to breakout the first resistance which is $9953 and then the second which is $12804.

TAGS: [ #bitcoin ] [ #cryptocurrency ] [ #steemit ] [ #usd ] [ #news ]

Replies

NO REPLIES FOUND.

[ BACK TO TRENDING ] [ BACK TO MENU ]
CMD>