+-+-+ +-+ +-+-+-+-+
|G|O| |4| |H|I|V|E|
+-+-+ +-+ +-+-+-+-+

 --- A GOPHER-LIKE INTERFACE FOR HIVE BLOCKCHAIN ---

Historic Steem Currency Price Chart

BY: @steemreports | CREATED: April 30, 2018, 2:10 p.m. | VOTES: 9 | PAYOUT: $5.02 | [ VOTE ]

[IMAGE: https://steemitimages.com/DQmNwGBk26F2xRRp7cuX2QgvLVoWKTqEfzpVdMt1ta83cJz/image.png]
http://steemreports.com/historic-steem-sbd-rates/USD

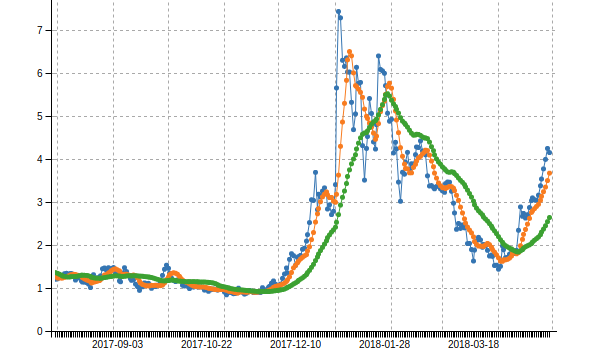
I've made a chart view which shows STEEM and SBD daily average prices on the same chart. It starts in Jan 2017, and also allows various derivatives (ratios and moving averages) to be shown by clicking on the legend at the bottom.

This is the data used for the account tools, so you can also view the data in other fiat currencies: EUR, GBP, CAD and AUD if you prefer.

TAGS: [ #steemdev ] [ #steem ] [ #prices ] [ #stats ] [ #chart ]

Replies

@demotruk | April 30, 2018, 2:14 p.m. | Votes: 1 | [ VOTE ]

Would it be complicated to add the historic price of a MVest to this?

@steemreports | April 30, 2018, 5:01 p.m. | Votes: 1 | [ VOTE ]

I might add that in future. It would need a secondary y axis, and would pretty much follow the shape of the Steem graph I suppose.

The main reason I didn't was that as I've mentioned in the posts about the financial report tools, I'm less sure about quality of the MVest/Steem ratio data.

@mysearchisover | April 30, 2018, 2:46 p.m. | Votes: 2 | [ VOTE ]

Rally time! :)

@steemreports | April 30, 2018, 5:02 p.m. | Votes: 0 | [ VOTE ]

I wish I knew! :)

[ BACK TO TRENDING ] [ BACK TO MENU ]
CMD>