I consider BTC right now to be in a no trade zone as there seems to be equal arguments for price to go up or down, here I will provide 2 perspectives to predict potential price moves if BTC is bullish or bearish
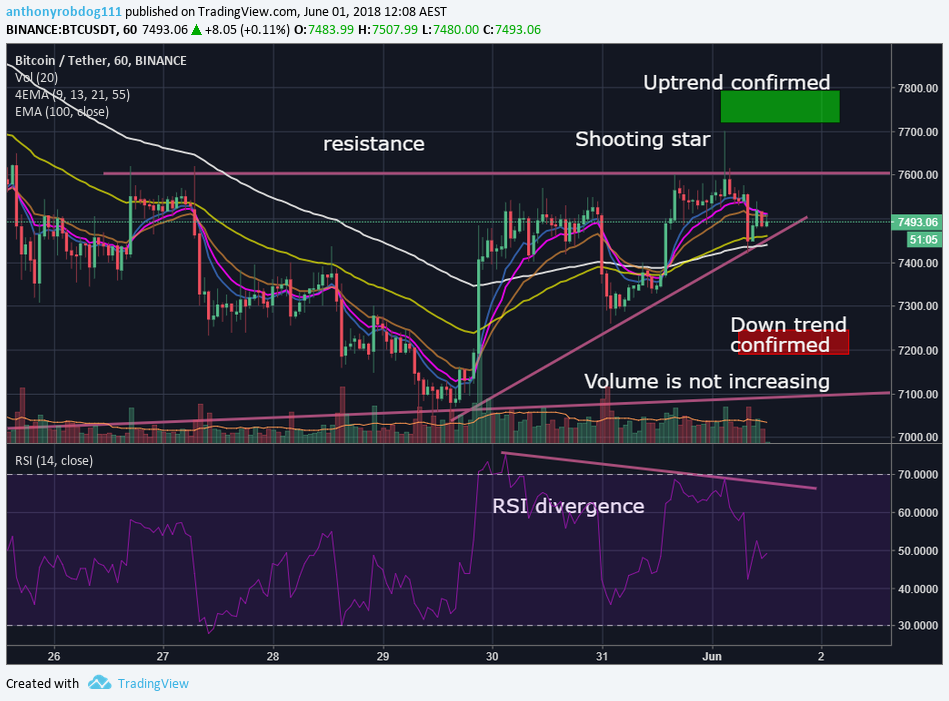
CHART 1: BEARISH
We are currently seeing RSI divergence mean the bulls are weaker, furthermore we are faces a lot of resistance at this 7,600 region, and also a large shooting star candle rejecting the bulls.
[IMAGE: https://cdn.steemitimages.com/DQmUfsYuwdZVz32ibtPk4vuh8cTuGfwFM1MK6jUTB8NCPht/www.tradingview.png]
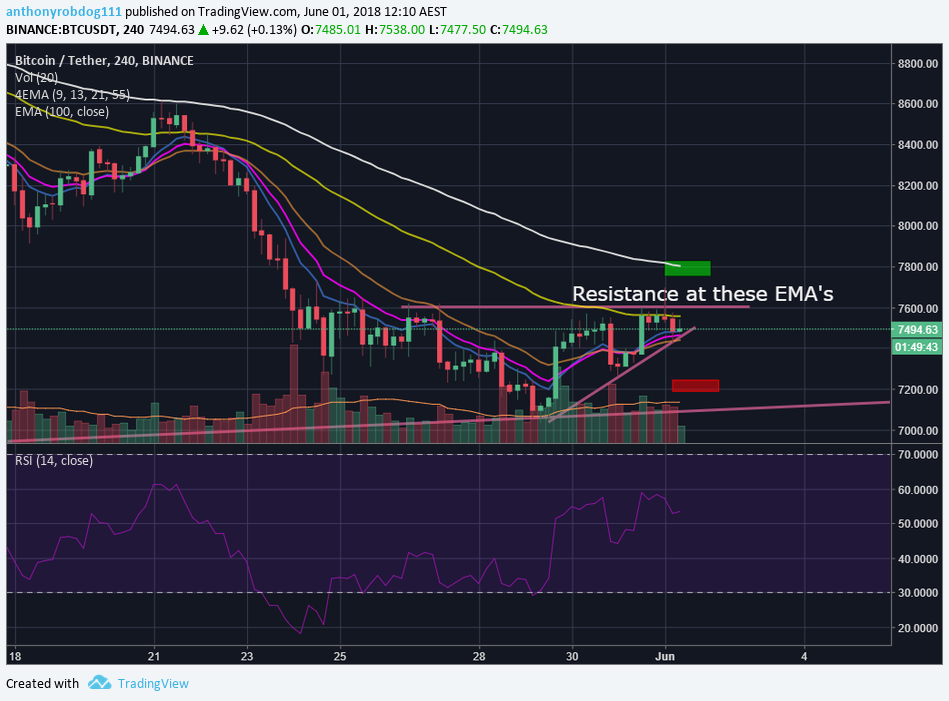
CHART 2: BEARISH
4Hour time frame showing resistance at EMA
[IMAGE: https://cdn.steemitimages.com/DQmPMpUrkd3ZNNfz3nqwhzGbMu3gLBG6hhkGm37wqazxiu9/www.tradingview.png]
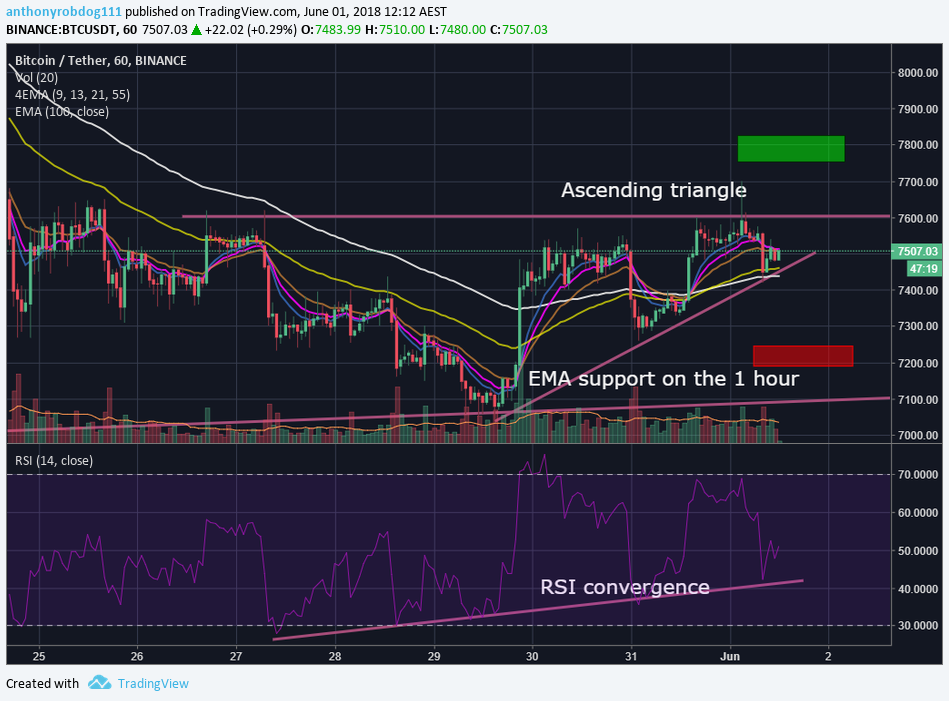
Now for the bullish perspective and evidence
The main indicators for this bullish count are the ascending triangle which usually break upwards and the elliot wave count. Ultimately, having a position at the moment is a real gamble and I would suggest waiting for confirmation before making a position
[IMAGE: https://cdn.steemitimages.com/DQmSuf6TszKnxMNJ6LvccAjwUdb3mzrNnwurGktNnMrpWB7/www.tradingview.png]