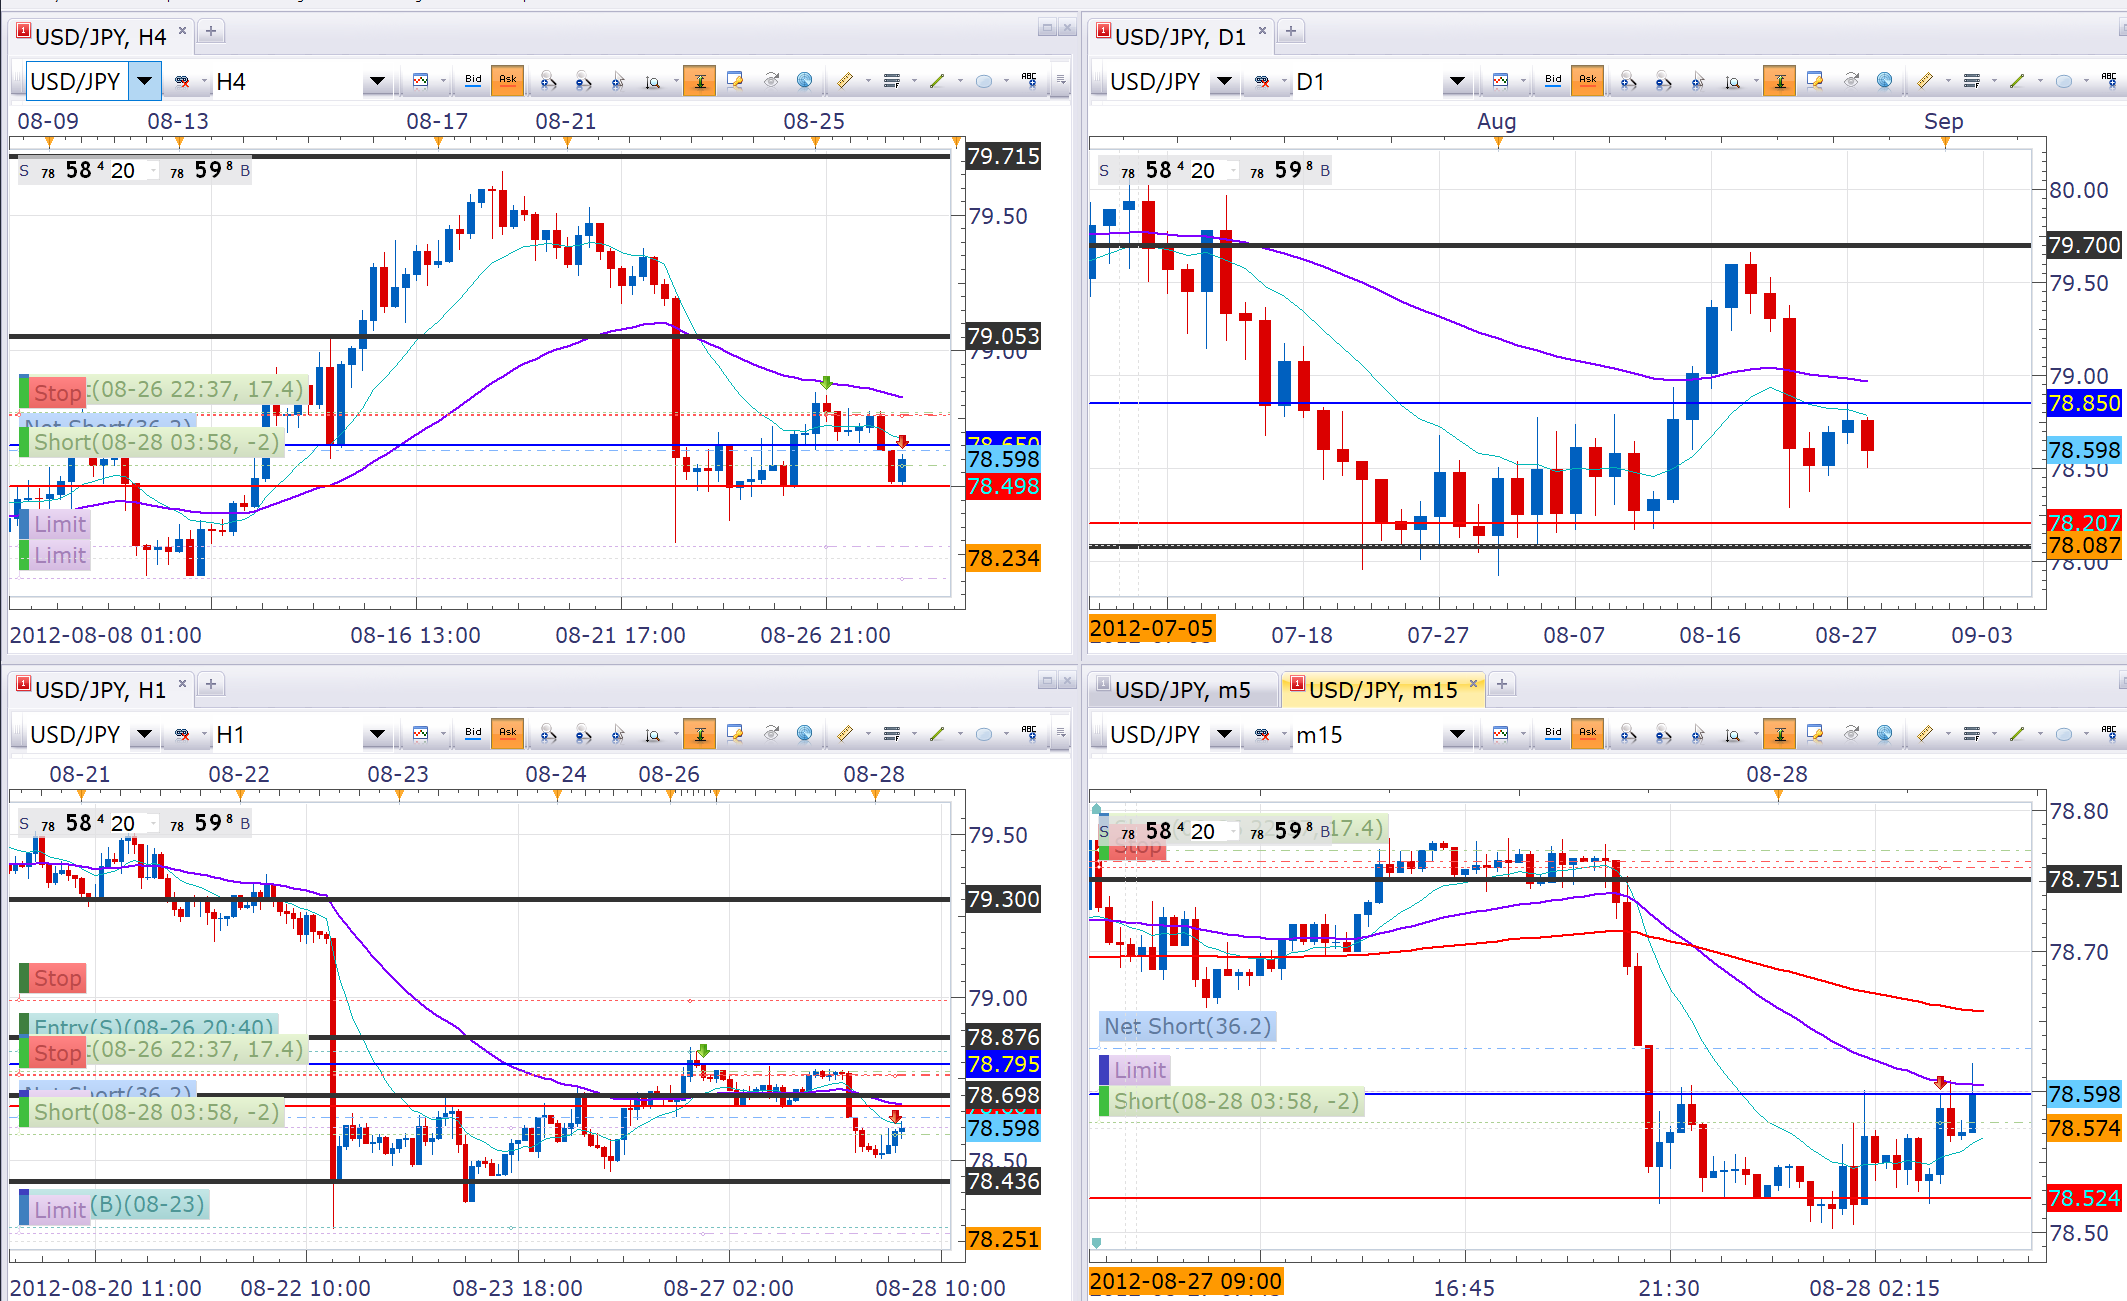
technical charts show the markets expected true value of a currency and the aer psychological factors and patterns that the market tends to react to and conform to. here is my research and findings on the USDJPY price action during August 2012:
[IMAGE: https://steemitimages.com/DQmQe1jc2csN6NAXr2NVSE1VecwKGmF3ZUbbJ4yRxffEaH9/image.png]
- Daily has found some support at the 78.50 mark
- 4hr shows that prices are under the EMA’s and looking to retest previous resistance
- 1hr shows that price istesting the EMA’s now
- The 15min shows that the 50 EMA is being tested and the 14 is starting to act as support
- The expectation is that prices will test the bottom of the daily range because all the majority of the higher timeframe prices action is below all their EMA's the overall preference would be to continue selling the pair until it reaches it previous low of 78.08 YEN. at this price point price has reacted and retraced or even reversed.